As you are now all too aware, the foreign exchange market is one of the most liquid yet volatile in the world. As such, you had better believe you need help to gain insight into market sentiment. This enlightenment is achieved by studying technical analysis.
Eightcap - Regulated Platform With Tight Spreads

- Minimum deposit of just 250 USD to get lifetime access to all the VIP channels
- Use our Secure and Encrypted Infrastructure
- Spreads from 0.0 pips on Raw Accounts
- Trade on the Award-Winning MT4 & MT5 Platforms
- Multi-jurisdictional Regulation
- No Commission Trading on Standard Accounts

So, what is technical analysis? It’s a trading discipline that uses charts and indicators to study various data from past and present – in relation to the pair you are trading.
Part 4 of this beginners forex course talks about a plethora of technical indicators and charts – measuring trends, momentum, volume, and volatility.
Learn 2 Trade Forex Course - Master Your Forex Trading Skills Today!

- 11 core chapters will teach you everything you need to know about forex trading
- Learn about forex trading strategies, technical and fundamental analysis, and more
- Designed by seasoned forex traders with decades of experience in the space
- Exclusive all-in price of just £99

What is Technical Analysis?
Before you can enter the currency markets, you need to have some idea of what the general sentiment is on your desired forex pair. This is where some research and knowledge of the markets is required.
The best way to evaluate and identify forex trading opportunities is via technical analysis. This will see you looking at the historical price data and patterns – which should aid you in correctly forecasting fluctuations in the future. After all, history quite often repeats itself in the currency markets.
Some of the most used types of technical analysis tools are indicators, chart patterns, and candlestick formations – all of which we talk about throughout part 4 of this forex trading course.
Technical Analysis: Volume Indicators
As we said in part one of this course – ‘Why Should you Trade Forex?‘ – there are probably more trading tools available to forex traders than any other!
There is a type of technical indicator for trends, volume, momentum, and volatility – all of which we talk about in the sections below.
On-Balance Volume Indicator
The ‘On-Balance Volume Indicator’, or OBV, was created in the 60s to focus on volume and whether this is might force prices down or up. In other words, this indicator aims to help you quantify buying and selling pressure.
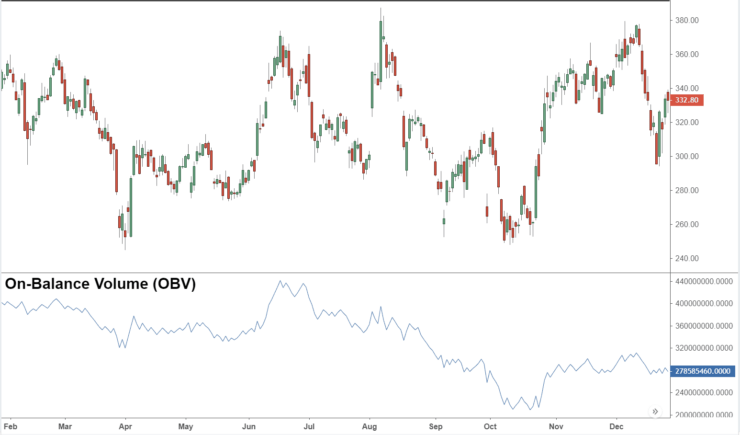
- The OBV is what’s known as a cumulative indicator
- When the price falls, any volume from the day is taken away from the on balance volume total
- When prices rise, the volume will be added to the on balance volume total
Then, at the end of each trading day, the volume from the day is added to the cumulative total and the day’s volume is deducted. This gives us a much clearer picture of potential future price movements.
Accumulation/Distribution Line Indicator
The ‘Accumulation/Distribution Line’, or AD, gives us a much clearer picture of potential future price movements by measuring dissimilarities in volume and price.
This indicator is valuable for technical analysis as it evaluates the movement of cash in and out of the forex market in question. It achieves this by studying trading range, as well as volume, over a specified amount of time.
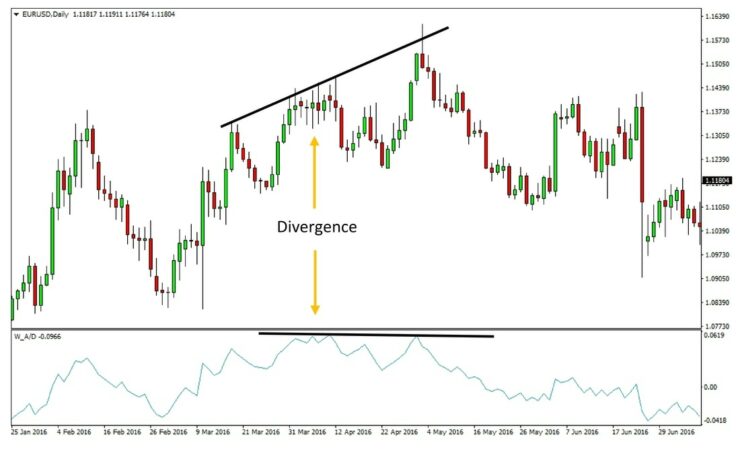
- Step 1: The indicator works out the ‘close location value’, or CLV. This entails making a comparison between the range over a specific period of time, and the closing price of the same period. This ranges between -1 and +1.
- Step 2: The AD indicator then multiplies the volume over that timeframe with the close location value to indicate money flow. If you see a negative figure, this shows us cash is flowing in, if the value is positive – cash is flowing out.
- Step 3: Finally, the calculation is carried out over various timeframes.
In a nutshell, this indicator keeps a running total of cash flowing in and out of our chosen currency pair. The good news is that you don’t really need to do any calculations yourself as the results will be displayed for you when you deploy the indicator.
Money Flow Index Indicator
We commonly used the ‘Money Flow Index’ indicator (MFI) when performing technical volume analysis – as it is great for calculating market sentiment.
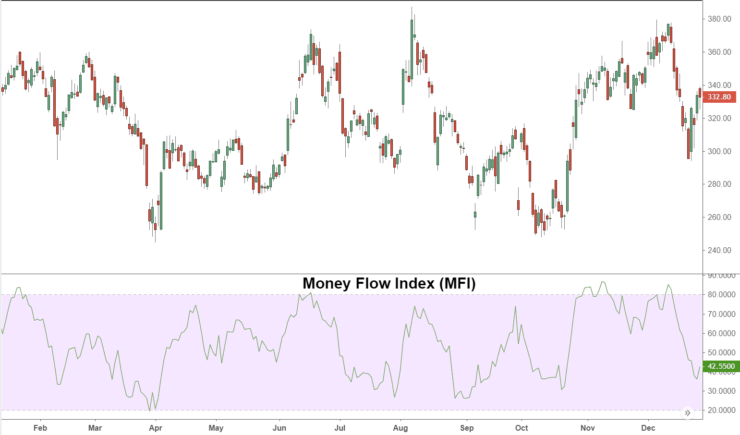
- Generally speaking, if the MFI had a reading of over 80 – you are looking at a market in the overbought territory.
- As such it’s likely to experience a pullback.
- If the MFI is below 20 – it’s likely the market is in the oversold camp.
- As such, this could indicate a bounce-back in the near future
This is not to be confused with the ‘Chaikin money flow’ indicator. This measures money flow volume within a specified timeframe – a commonly period is 20-21 days. Thus, this draws up more similarities with the ‘Moving Average Convergence Divergence’ which we talk about later.
Instead, the MFI indicator combines the latest price shift data with volume to decipher whether the momentum on the pair is going upwards or downwards.
Technical Analysis: Trend Indicators
As the title suggests, when you are carrying out technical analysis, you will also see ‘trend’ focussed indicators. As you no doubt guessed – this shows you the direction of a rising or falling market.
By studying this, you can gain a better understanding of whether a trend is about to happen – so you can place the relevant order and hopefully cash in on it! See below the most popular trend indicators for inspiration.
Moving Average Convergence/Divergence (MACD)
The ‘Moving Average Convergence/Divergence’, or MACD, is a technical indicator that illustrates the moving average of a currency pair’s price action.
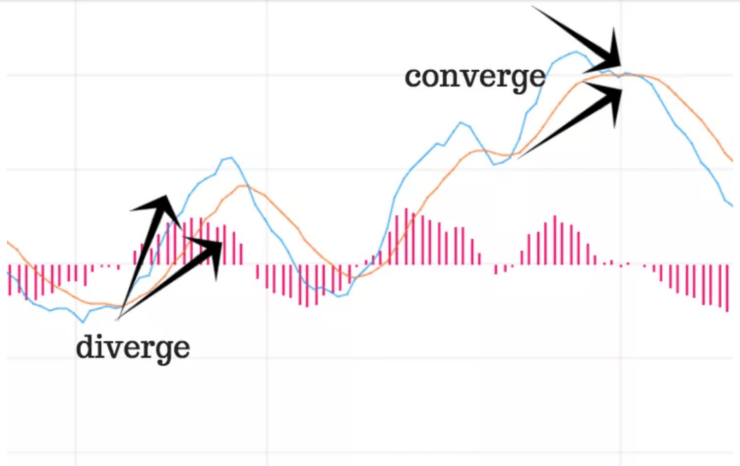
- If the MACD line crosses over the signal line, this shows you that the trend is likely to reverse. So, if the market is bearish it will switch to bullish, and vice versa. This will help you decide when to enter a trade. If the crossover is above the centerline it is bullish
- If the MACD line neglects to crossover, but the lines are touching, this shows us that the current trend is likely to continue. If the signal line crosses from below to above the line, this indicates a bullish signal. If it is above to below, then this is a bearish signal.
- The further the trend lines are from the centre of it, the more likely it is that momentum on the pair is on the up. You will probably look to sell when the price is underneath the moving averages, and the lines are below the centerline.
- If the height of the histogram is higher than the 0 line – the trend is more likely to turn bullish. If it is underneath, the bearish trend will continue. If the histogram slowly creeps upward, this could indicate a sell signal.
- A difference in direction between the MACD and signal lines or the histogram with price action could give you an early indication of a trend reversal. This is vital information and in some cases could lead you to cancel a limit order you have already set up.
Notably, this particular technical indicator is used as a way to confirm trends and should be utilized alongside other indicators for a bigger picture. You should never rely on the histogram or MACD alone for predicting the sentiment of the currency markets.
Average Directional Index (ADX)
The ‘Average Directional Index’, or ADX, is an oscillator tasked with measuring the strength of trends in the currency markets.
This indicator is combined into three segments: You have the ADX, as well as the negative (-DI) and positive indicators (+DI). This is going to give you a clearer indication of whether you are better taking a long or short position at your chosen forex broker. If analysis points toward a weak trend on your chosen pair, you are very unlikely to enter the market at that time.
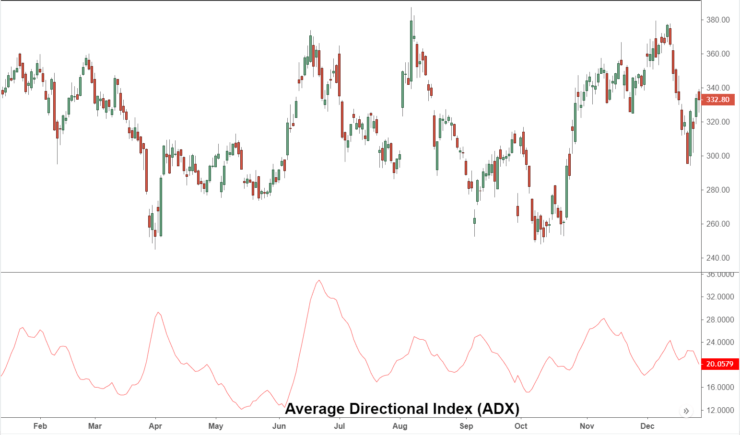
- The ADX will aid you in gauging the strength of the trend
- The negative and positive directional indicators, -DI and +DI, will show you the direction of the trend
There are 3 separate lines here, so let’s take a look at how you can interpret the average directional index:
- The ADX is over 25: This shows us that the trend on the pair is strong
- The ADX is under 20: This indicates that the trend of the pair is weak
- The ADX is higher than 20-25 and the +DI line crosses higher than the -DI line: This could illustrate a buy signal
- The ADX is higher than 20-25 and the -DI line crosses higher than the +DI: This could indicate that you should short the pair.
The ADX can be used to plan your exit from the currency markets too. For instance, if you are already long, you might close your trade as soon as -DI goes above +DI.
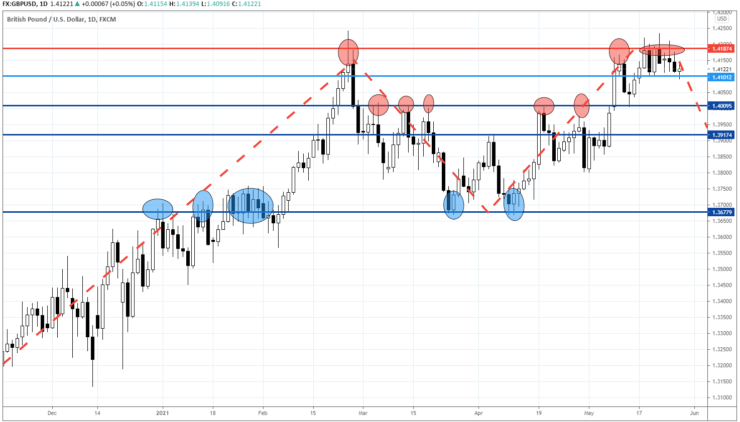
Moving Average (MA)
When researching technical analysis you have probably come across ‘Moving Average’ (MA) indicators. This entails generating multiple averages that include a variety of subsets of the complete data set – to analyze data points.
So what does this mean? Let’s cut out the jargon, – what you get from an MA is an indicator that can remove the extra noise created by short-term price spikes. This smooths out trends to give you a much clearer picture of where the market is at with your chosen FX pair.
In fact, this indicator is so commonly used that if you hook your broker account with third-party trading platform MetaTrader 4 (MT4) or MT5, this one comes included as standard. You will probably have access to variables with the moving average indicator too.
This includes:
- MA method: The default setting for this is ‘Simple’ which is the unweighted mean of the previous number of time periods.
- Time period: This is the preferred timeframe in which the moving average will be calculated
This trend indicator is a lagging one, which means there is a slight delay. With that said, many people rely on moving averages to confirm divergence, support, and resistance, as well as spotting momentum and trends.
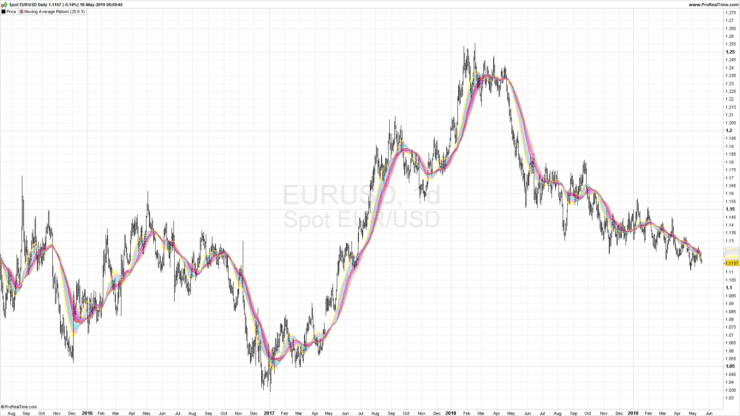
- If the price is higher than the MA – this is a strong indication of a bullish market
- Alternatively, if the price is lower – this shows a bearish trend
- Each time a new trend is formed, the price will break away from the MA in either direction
Notably, sometimes a price will cross the aforementioned moving average – with a new trend nowhere to be seen. With this in mind, some like to use the ribbon strategy which sees them using between 6 and 16 moving averages with multiple timeframes – on the same chart.
There are heaps of strategies out there that combine the MA indicator with others to offer a fuller picture of market sentiment. We talk about other forex trading strategies in part 9 of this course.
Ichimoku Kinko Hyo
‘Ichimoku Kinko Hyo, or ‘Ichimoku’ for short, is more of a trading system than an indicator. With that said, it is a big part of technical analysis for most forex traders as it identifies the direction of a trend and general market balance. The Ichimoku is also relied upon to identify momentum.
Here’s what Ichimoku Kinko Hyo means:
- The English translation of Ichimoku is ‘one look’ – eluding to the fact a quick glance is all you need
- The translation of Kinko (Kinkou) is ‘equilibrium’ – meaning balance
- The translation of Hyo is ‘chart’, which is self-explanatory.
Goichi Hosada spent three decades designing this system to allow traders to view the balance of a currency market with one look.
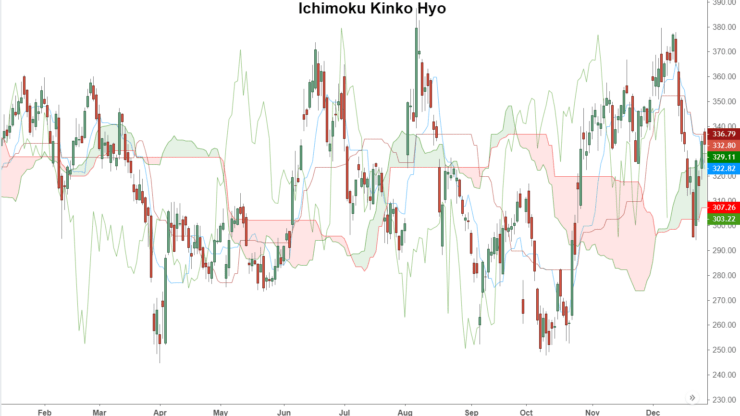
- The base line (kijun sen): This illustrates the lowest low and highest high, divided by two – covering the previous 26 periods. This line will be red.
- The trigger line (tenkan sen): This shows us the lowest low and highest high, divided by two – covering the previous 9 periods. This line will be black.
- The lagging line (chikou span): This puts the closing prices of the asset 26 periods behind the most recent closing value. If this crosses with previous prices, it might show a potential trend reversal. This relates prevailing price trends to current price strength.
The fourth element of Ichimoku is:
- The cloud (kumo): This includes two lines, span A and B.
- The first leading line (span A): This is a calculation of the base line, plus the trigger line, divided by two. The result will be added 26 periods in front of the present price action.
- The second leading line (span B): This is the calculation of the lowest low and highest high, divided by two. This sum covers the previous 52 timeframes and will be plotted 26 ahead.
Interestingly, some traders opt to use the fourth element on its own to isolate probable trades – using it as a filter system.
Scalpers use this system on a 1-minute to 6-hour chart, whereas swing traders would be more likely to study a daily or weekly chart. Notably, there is no point at all in using Ichimoku when there is no obvious trend in the making.
Parabolic SAR Indicator
Last but not least in terms of trend identifiers is the ‘Parabolic SAR’ indicator.
This could give you the sense of direction you need to enter a position when a trend is happening, whilst at the same time doing so in a secure marketplace.
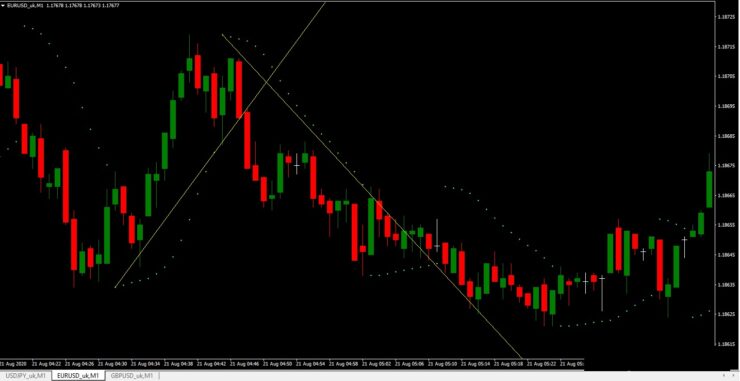
- If it shows the SAR dots on top of the market value – this illustrates a downward trend
- If it shows the SAR dots underneath the present market value – this points to an upward trend
This works really well with the aforementioned ADX for getting a crystal clear image of how strong a trend really is. You can also add candlestick charts and MA indicators to the mix with this one. You can also use the Parabolic SAR indicator to put stop-loss orders in place.
Technical Analysis: Momentum Indicators
This section of our technical analysis guide covers the top two momentum indicators. These allow currency traders to identify when the markets might see a reversal.
As such, this is another helpful tool in predicting this sometimes volatile asset class. You can use the momentum indicators that follow alongside trend systems and such, to give you the bigger picture.
Stochastic Oscillator
The ‘Stochastic Oscillator’ is useful for measuring momentum which aids you in detecting a possible change in price direction. It calculates the strength of the market by drawing a comparison between the closing value and the reading range over a specific timeframe.
- This indicator used a scale of 0 – 100
- If the Stochastic line is above 80 – the currency market is likely in overbought territory
- If the Stochastic line is below 20 – the currency market is likely in oversold territory
If the indicator is showing an overbought market, this is usually a clear message to sell. Alternatively, if it’s oversold, you would probably be heading to your brokerage to place a buy order.
Relative Strength Index (RSI)
The ‘Relative Strength Index’, or RSI, calculates the ratio of both upward and downward movements – signalling bearish and bullish markets.
As such, this technical analysis indicator should be one of the first you learn how to use. It is super useful for spotting short-term overbought and oversold circumstances in the market.
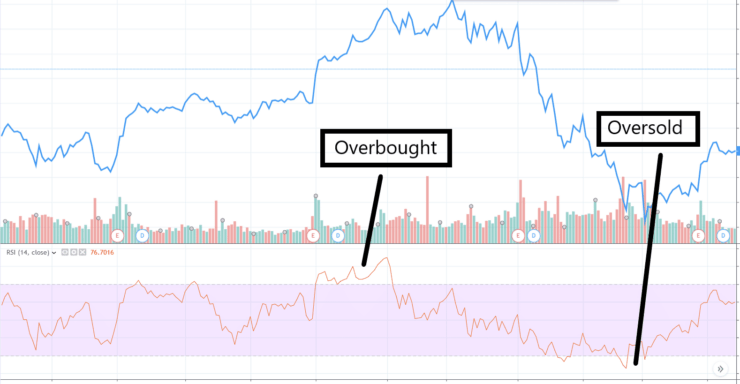
- The RSI is demonstrated in a range of 0 to 100
- If the RSI line is 80 or higher, this shows us that the market is probably in the overbought camp
- If the RSI line is less than 20, this points towards an oversold pair
- The neutral zone of the RSI is between 20 and 80
You can even try out this or any other indicator by signing up for a forex simulator – allowing you to take it for a test-drive risk-free. AvaTrade provides access to a demo account via MT4 – which is packed with technical analysis tools.
The top-rated broker will give you a virtual portfolio with $100k in paper funds to practice technical analysis with.
Technical Analysis: Volatility
When you are learning the ins and outs of technical analysis, you will probably utilize more than one trading tool. This is going to give you a clearer idea of the marketplace’s attitude towards the FX pair in question.
With this in mind, below we discuss the three volatility systems we think are worth exploring.
Standard Deviation
‘Standard Deviation’ is a fairly simple trading tool compared to most. Its job is to spot any unusual price fluctuations in the market. As such, the main focus of this indicator is to clearly display any volatility in your chosen currency pair.
Statistically, this shows us how widely prices are separated from the average or mean values. Like with most indicators, you can choose a specific timeframe to view data – for example, 20 periods.
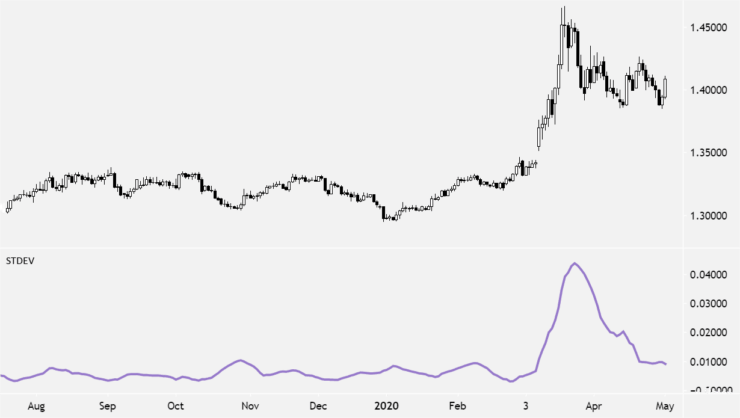 So, how do we interpret Standard Deviation? See below for another simple example:
- If the value shown on the Standard Deviation is at a low level, this illustrates low market volatility
- Alternatively, if this is at a high level, meaning that prices are shifting wildly in either direction – this points towards high volatility
In a nutshell, this indicator is going to tell you how wildly the currency pair’s current price differs from its average. You might try using this along with Bollinger Bands, which we talk about next.
Bollinger Bands
‘Bollinger Bands’ is another technical analysis tool on this list that should be at the core of your forex trading endeavours. This insight into currency volatility helps you to make tough choices on when to enter and exit the market.
The Bollinger Bands indicator shines some light on overbought and oversold currencies. It is important to note that this trading tool is rarely used alone. Many traders study this indicator in conjunction with the aforementioned RSI.
 See below how to read the 3 elements of Bollinger Bands:
- At the top you will see the ‘upper standard deviation line’ – this band illustrates upper price range levels
- In the middle you will see the ‘simple moving average’ (SMA) – most people set this to a period of 20 days.
- At the bottom you will see the ‘lower standard deviation line’ – this band illustrates lower price range levels
- The wider the gap between the top and bottom bands. the more volatile the market is, and vice versa
As you can see, the bands in this indicator act as price envelopes, showing us the moving average of the value of the forex market in question. Thus offering insight into how volatile forex market conditions are.
Average True Range (ATR)
The ‘Average True Range’ (ATR) will give you some idea of when you might want to initiate or abandon a trade by showing you how much a market shifts within a specific timeframe.
You can also use ATR to decide where to place a stop-loss order. If you need a recap, we talked about orders in part 3 of this course ‘Pips, Lots and Orders‘.
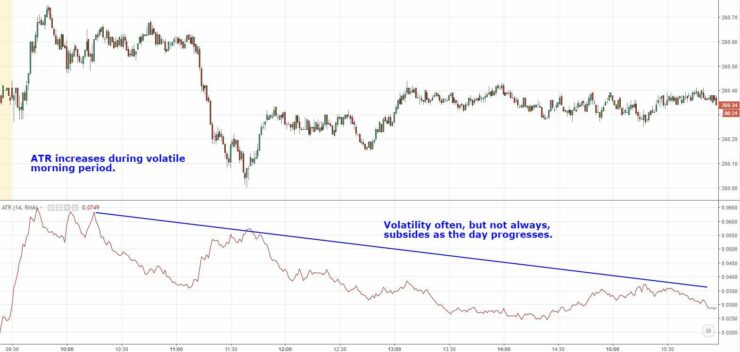
See below how you can interpret this technical analysis tool:
- As you can see, ATR is a singular line on the chart above
- If the ATR is on the high side – this illustrates increased market volatility
- Alternatively, if the ATR is lower – this generally means there is less volatility
How close or far away from the upper and lower Bollinger lines are from one another tells us how volatile the market is. After studying this data, your forex trading strategy could see you making gains from such volatile conditions, or choosing to exit a trade that is already open.
Technical Analysis Chart Types
Throughout part 4 of this course, you will have noticed that the indicator examples come in different shapes and sizes.
There are various charts used in technical analysis, so we briefly explain the main three below – bar, line, and candlesticks.
Bar Charts
A bar chart in technical analysis will illustrate to you the highs and lows as well as opening and closing values of the FX pair in question. As you can see, it is displayed as a simple vertical line with forks coming off it.
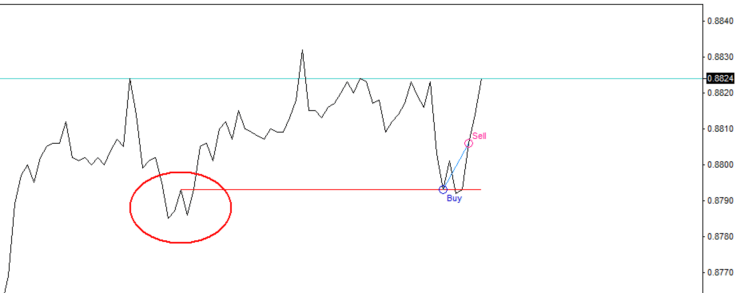
Line Charts
As you might expect, line charts illustrate one closing price to the next by drawing a simple line.
Eightcap - Regulated Platform With Tight Spreads
- Minimum deposit of just 250 USD to get lifetime access to all the VIP channels
- Use our Secure and Encrypted Infrastructure
- Spreads from 0.0 pips on Raw Accounts
- Trade on the Award-Winning MT4 & MT5 Platforms
- Multi-jurisdictional Regulation
- No Commission Trading on Standard Accounts
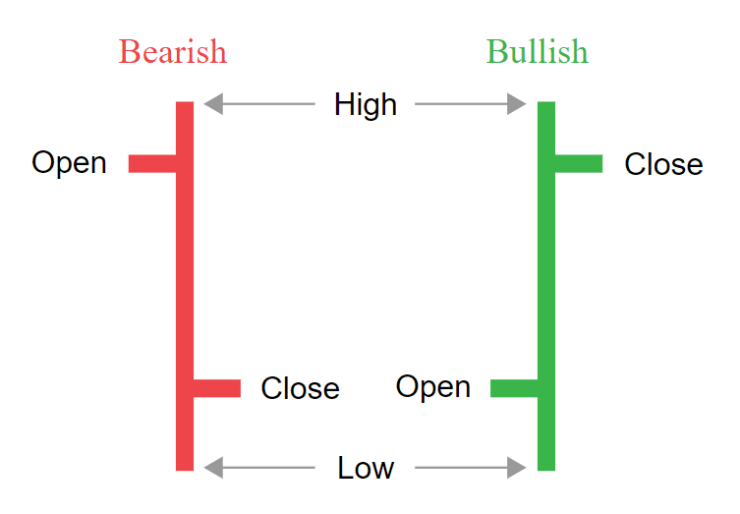
Candlestick Charts
You won’t study technical analysis for long without coming across a candlestick chart.
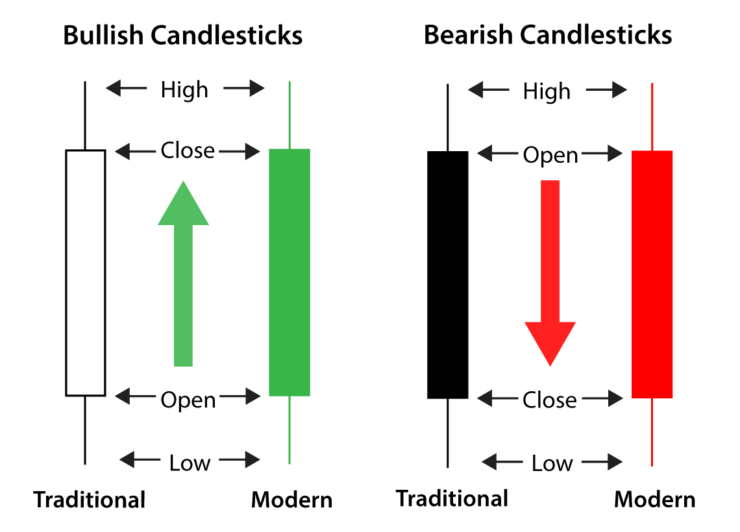
This consists of multiple candlesticks, each of them are made up of:
- A body: This illustrates the open and close range of the timeframe chosen
- A wick: This is also commonly referred to as the candlestick shadow and shows us the high and low price of that period
- A green or white candle body: This illustrates a price rise on the FX pair
- A back or red candle body: This shows us a decrease in value
This is also one of the preferred types of chart patterns, as it’s fairly simple and easy to read at a glance.
Technical Analysis: Full Conclusion
Technical analysis is a trading discipline through and through. Sure, it can be daunting, but all the information gathered from this research will only enhance your currency trading experience. Instead of a gung ho approach, it’s better to make informed decisions from real data, especially when you are using your hard-earned money rather than a free demo account facility.
The timeframe, pattern, and indicators you elect to use will depend on your trading strategy, but there is no shortage of options. For instance, if you are planning on day trading, opening, and closing currency positions within one day, you might study a 15 or 60 minutes timeframe on both the MA and RSI.
Scalpers on the other hand might look for a temporary variance in price trends using the Parabolic SAR, MACD, and EMA indicators simultaneously on a period of between 1 and 15 minutes. For any tips on how to create a forex trading strategy, you can check out part 9 of this course.
Learn 2 Trade Forex Course - Master Your Forex Trading Skills Today!
- 11 core chapters will teach you everything you need to know about forex trading
- Learn about forex trading strategies, technical and fundamental analysis, and more
- Designed by seasoned forex traders with decades of experience in the space
- Exclusive all-in price of just £99