Being successful when trading forex can be tough going. But that does not stop millions of us from having a crack at it every day – some more victoriously than others. That is why forex indicators are crucial.
Our Forex Signals
1 - month
Subscription
 Up to 15 signals daily
 76% success rate
 Entry, take profit & stop loss
 Amount to risk per trade
 Risk reward ratio
month
3 - month
Subscription
 Up to 15 signals daily
 76% success rate
 Entry, take profit & stop loss
 Amount to risk per trade
 Risk reward ratio
month
 Most popular
6 - month
Subscription
 Up to 15 signals daily
 76% success rate
 Entry, take profit & stop loss
 Amount to risk per trade
 Risk reward ratio
month
Lifetime
Subscription
 Up to 15 signals daily
 76% success rate
 Entry, take profit & stop loss
 Amount to risk per trade
 Risk reward ratio
Separate Swing Trading Group
 Up to 3 signals weekly
 76% success rate
 Entry, take profit & stop loss
 Amount to risk per trade
 Risk reward ratio
month
1 - month
Subscription
 Up to 15 signals daily
 76% success rate
 Entry, take profit & stop loss
 Amount to risk per trade
 Risk reward ratio
time
Thankfully there are a plethora of tools available to guide us in making such challenging decisions. The likes of indicators and charts unearth insight into forex price trends, market sentiment, and price history.
3
Payment methods
Trading platforms
Regulated by
Support
Min.Deposit
Leverage max
Currency Pairs
Classification
Mobile App
Min.Deposit
$100
Spread min.
Variables pips
Leverage max
100
Currency Pairs
40
Trading platforms
Funding Methods


Regulated by
FCA
What you can trade
Forex
Indices
Actions
Cryptocurrencies
Raw Materials
Average spread
EUR/GBP
-
EUR/USD
-
EUR/JPY
0.3
EUR/CHF
0.2
GBP/USD
0.0
GBP/JPY
0.1
GBP/CHF
0.3
USD/JPY
-
USD/CHF
0.2
CHF/JPY
0.3
Additional Fee
Continuous rate
Variables
Conversión
Variables pips
Regulation
Yes
FCA
No
CYSEC
No
ASIC
No
CFTC
No
NFA
No
BAFIN
No
CMA
No
SCB
No
DFSA
No
CBFSAI
No
BVIFSC
No
FSCA
No
FSA
No
FFAJ
No
ADGM
No
FRSA
71% of retail investor accounts lose money when trading CFDs with this provider.
Min.Deposit
$100
Spread min.
- pips
Leverage max
400
Currency Pairs
50
Trading platforms
Funding Methods


Regulated by
CYSECASICCBFSAIBVIFSCFSCAFSAFFAJADGMFRSA
What you can trade
Forex
Indices
Actions
Cryptocurrencies
Raw Materials
Etfs
Average spread
EUR/GBP
1
EUR/USD
0.9
EUR/JPY
1
EUR/CHF
1
GBP/USD
1
GBP/JPY
1
GBP/CHF
1
USD/JPY
-
USD/CHF
1
CHF/JPY
1
Additional Fee
Continuous rate
-
Conversión
- pips
Regulation
No
FCA
Yes
CYSEC
Yes
ASIC
No
CFTC
No
NFA
No
BAFIN
No
CMA
No
SCB
No
DFSA
Yes
CBFSAI
Yes
BVIFSC
Yes
FSCA
Yes
FSA
Yes
FFAJ
Yes
ADGM
Yes
FRSA
71% of retail investor accounts lose money when trading CFDs with this provider.
Min.Deposit
$50
Spread min.
- pips
Leverage max
500
Currency Pairs
40
Trading platforms
Funding Methods


What you can trade
Forex
Indices
Actions
Raw Materials
Average spread
EUR/GBP
-
EUR/USD
-
EUR/JPY
-
EUR/CHF
-
GBP/USD
-
GBP/JPY
-
GBP/CHF
-
USD/JPY
-
USD/CHF
-
CHF/JPY
-
Additional Fee
Continuous rate
-
Conversión
- pips
Regulation
No
FCA
No
CYSEC
No
ASIC
No
CFTC
No
NFA
No
BAFIN
No
CMA
No
SCB
No
DFSA
No
CBFSAI
No
BVIFSC
No
FSCA
No
FSA
No
FFAJ
No
ADGM
No
FRSA
71% of retail investor accounts lose money when trading CFDs with this provider.
As you can imagine – access to such useful and in-depth information gives traders inside knowledge when it comes to the perception of the wider market
One of the most popular tools utilized is forex indicators, of which there are many different types. In this guide, we run through the 10 best forex indicators available and how you can use them to take your trading endeavours to the very next level.
Eightcap - Regulated Platform With Tight Spreads

- Minimum deposit of just 250 USD to get lifetime access to all the VIP channels
- Use our Secure and Encrypted Infrastructure
- Spreads from 0.0 pips on Raw Accounts
- Trade on the Award-Winning MT4 & MT5 Platforms
- Multi-jurisdictional Regulation
- No Commission Trading on Standard Accounts

What are Forex Indicators?
Before you even think about trading forex online, you should add the best indicators to your strategy.
What are forex indicators? Well, forex indicators are a big part of technical analysis, used by traders globally in order to aid the decision-making process.
When including indicators in your trading strategy, you are analyzing information about past and present. You will find this insight featured in indicators such as ‘lagging’ and ‘leading’.
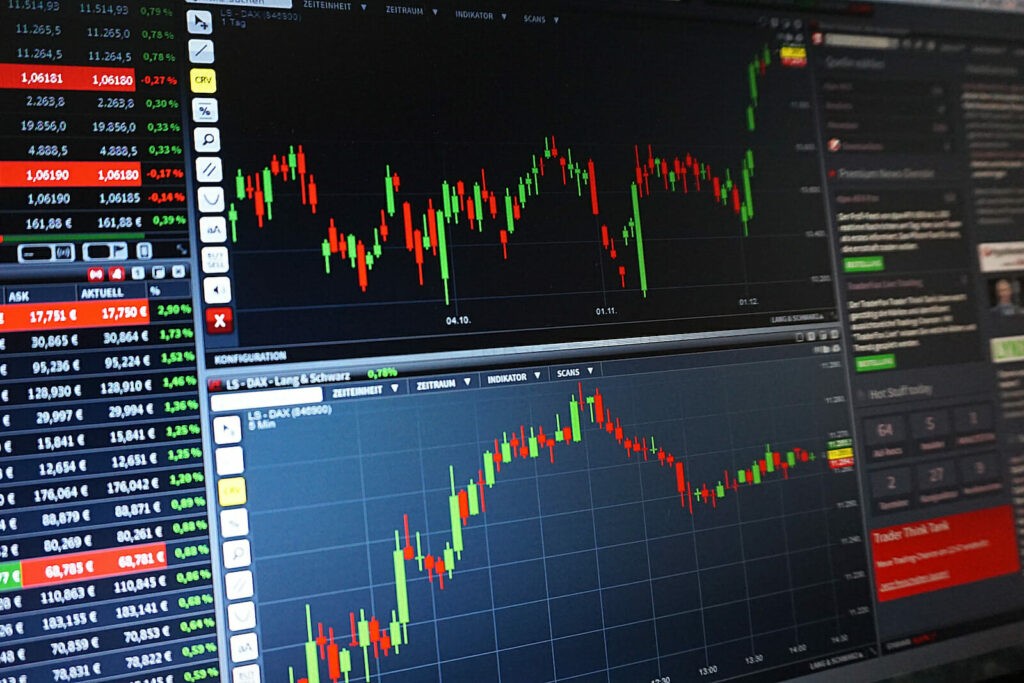
All in all, technical analysis in general is a major part of successfully trading forex. So, for clarity, the main components of technical analysis are as follows:
- Momentum/volume indicators.
- Oscillators.
- Moving averages.
- Chart patterns.
- Price trends.
- Support and resistance levels.
As you can see, there is lots of help available to traders. The best forex indicators are a key component to predicting market sentiment, amongst other factors, of trading foreign currencies.
By utilizing the technical indicators available at your fingertips, you stand a much better chance at being successful trading forex. Moreover, the majority of experienced traders swear by having a strong trading strategy behind them.
Crucially, learning how indicators work right now is as good a place to start as any. This brings us smoothly onto our 10 best forex indicators – all of which you can add to your own currency trading strategy.
1 – Relative Strength Index (RSI)
Starting with the Relative Strength Index – generally referred to as the RSI for short – this indicator is a popular form of technical analysis that traders use the world over.
For those unaware, the RSI is classed as an oscillator and is one of the best trends indicating tools on our list. Traders use the RSI for uncovering momentum, showing when an asset is in the overbought or oversold camp.
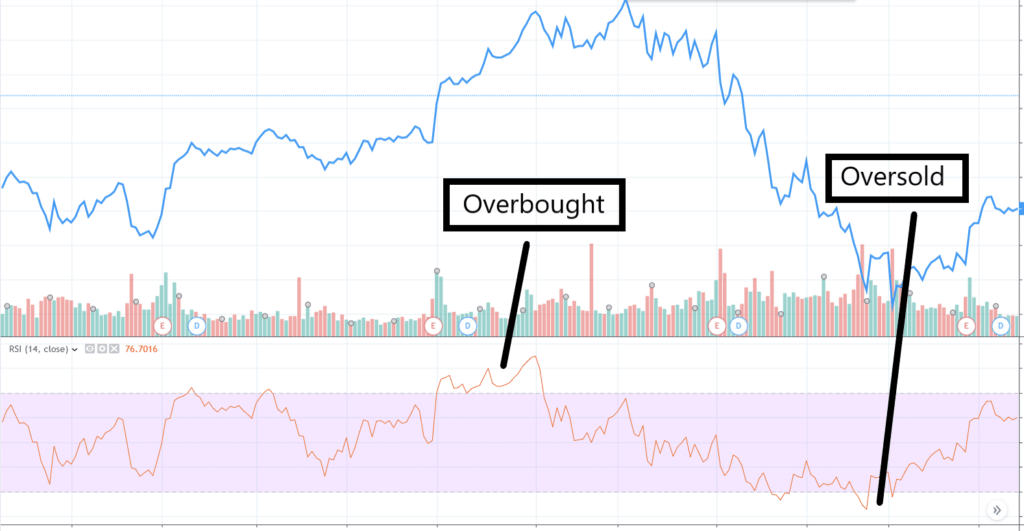
This oscillator is also excellent at illustrating both hidden and obvious divergence signals in the forex markets.
In a nutshell, the RSI is the quantification of the unprofitable closing value in relation to the profitable closing value – shown as a percentage which will shift between 0 and 100.
The calculation looks like this:
- RSI = 100 – 100 / (1 + RS).
We mentioned that the RSI indicates momentum in the financial market. So indicators of this type are used to calculate the velocity of forex price fluctuations.
Put simply, momentum indicators are a measure of short-term trends. Illustrating the durability and general health of the aforementioned price shifts – this is when ‘oversold’ and ‘overbought’ signals are generated.
As noted, the RSI shows a value between 0 and 100 which moves with the price fluctuations.
See below for clarification on both:
- If the RSI reading is over 70 – this tends to illustrate that the security is in overbought territory.
- If the RSI reading is under 30 – this tends to illustrate that the security is in oversold territory.
So, what exactly is an overbought signal and why is it useful? An overbought signal tells you that the particular forex pair you are interested in is overvalued.
This usually follows a time period where the asset has experienced an upward trajectory. As you likely know, the price cannot continue in the same direction for too long without doing a U-turn.
As such, the RSI gives you a much better chance at predicting when a reversal might happen. For instance, if RSI has moved over 70, this could signal that a drop in price is imminent.
Ergo, if you interpret the trend formation as a sign that a reversal is coming – you may choose to sell and lock in your profit
If on the other hand, if you see an oversold signal, the opposite is likely to happen. This could give you an indication that you should ‘go long’.
2 – Moving Average (MA)
Forex trading, especially in the short-term, entails keeping abreast with the latest price trends.
The Moving Average (MA) is one of the best forex indicators as it recognizes the direction of a price trend. Whilst also cutting out the extra noise of short term price fluctuations.
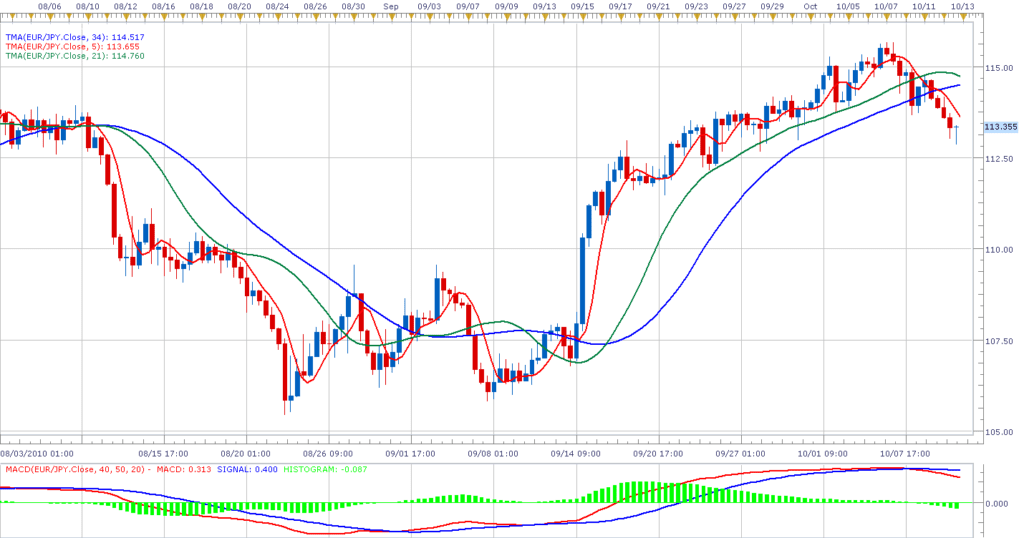 Calculating the MA can greatly help you to reveal any current and also emerging trends. The moving average essentially seeks out averages using mathematical equations and utilizes data to detect trends.
Put simply:
- The MA spots the aforementioned trends and price averages. And levels out price action by cutting out the interference of short-term drastic price shifts.
Most forex traders use multiple time periods when generating moving averages. The most popular moving average time frames tend to be 50, 100, and 200-day moving averages.
Although the MA is a fairly rudimental technical analysis tool – it is undoubtedly one of the best forex indicators, largely due to its simplicity.
Moreover, a moving average indicator can be tailored to any time span. This enables you to not only view trends but also gain some insight into which direction the asset is headed and an averaging customer price.
When there is a downward trend, the MA can perform as a ceiling, or ‘resistance’ so to speak. On the other hand, in the midst of an upward trend, the average performs as a ‘support’, or base.
We should note that due to the fact the MA can be calculated for any timeframe. You will be able to utilize it to predict both short and long-term forex trends.
If you wish to calculate the MA yourself, simply add together the set of numbers and then divide that figure by the respective values.
To clarify:
- Say you wish to calculate the moving average of a 2-year timeframe.
- Add together all of the numbers over the period.
- Divide the total number by 2.
Using multiple data subsets, the MA finds the average value. And crucially you can use it in conjunction with chart analysis.
As we touched on, this forex indicator is a handy tool for ascertaining levels of resistance and support. There are two types of MAs at the forefront and they are ‘simple moving averages’ (SMA) and ‘exponential moving averages’ (EMA).
SMA offers information on all values, and the latter concentrates on recent prices – which we talk about in more detail shortly.
3 – Moving Average Convergence Divergence (MACD)
The MACD is another popular tool on our best forex indicators list. This one spots shifts in momentum which is achieved by drawing a comparison from 2 moving averages.
By adding this forex indicator to your trading strategy you will be able to recognize potentially profitable trading opportunities surrounding resistance and support levels.
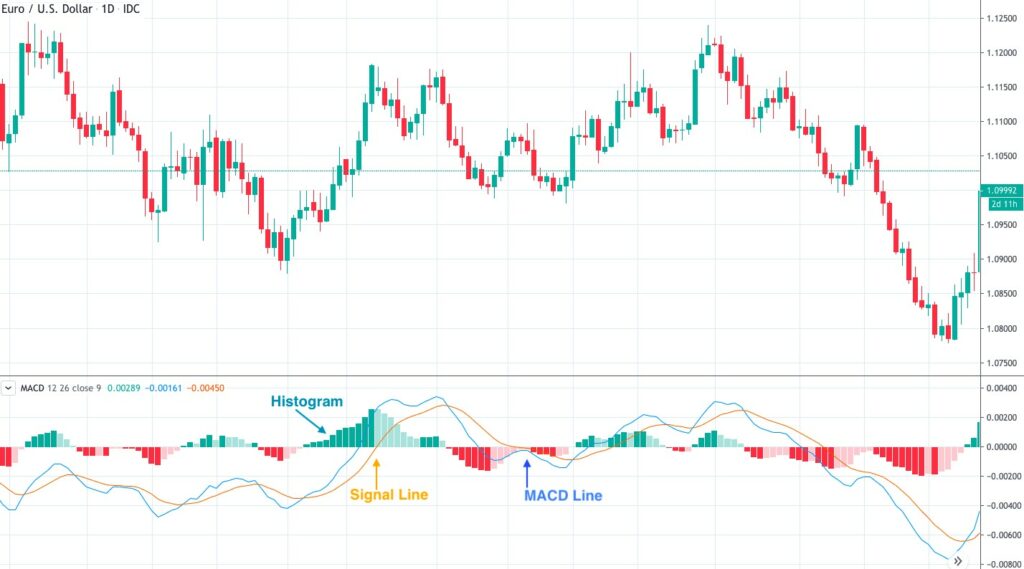
Take a look at a simple explanation of how the MACD indicator is made up:
- The signal line: It illustrates the shifts in price momentum, and also performs as a trigger – in terms of sell and buy signals. The signal line is the 9-period MA of the MACD.
- The MACD line: This line calculates the gap between the 2 moving averages. The MACD line is formed by deducting the 26-period MA, from the value of the 12-period MA.
- The histogram: This line calculates the contrast between the signal line and the MACD.
Only the signal line and the MACD line are utilized to calculate the MACD.
The MACD is shown as what is referred to as a ‘histogram’. You will see the contrast between the signal and MACD lines.
It can be taken as a sell signal if the MACD breaks through the signal line from above. If it breaks through from underneath you could use that as a buy signal.
This forex indicator is simplistic and dependable. Not only are you able to view the robustness and potential turning point of the trend – but also how strong sell and buy signals are.
This makes the MACD one of the best forex indicators for traders of all levels of expertise when it comes to an up-to-date illustration of market sentiment.
4 – Exponential Moving Average (EMA)
As we mentioned earlier, the MA is helpful for identifying trends – albeit. This particular indicator is focused more on recent price data. As such, some people call the EMA the ‘exponentially weighted moving average’.
In the short-term, the most commonly used EMA trend indicators tend to be between 12 and 26-days, or in the shorter term 5-20 minutes.
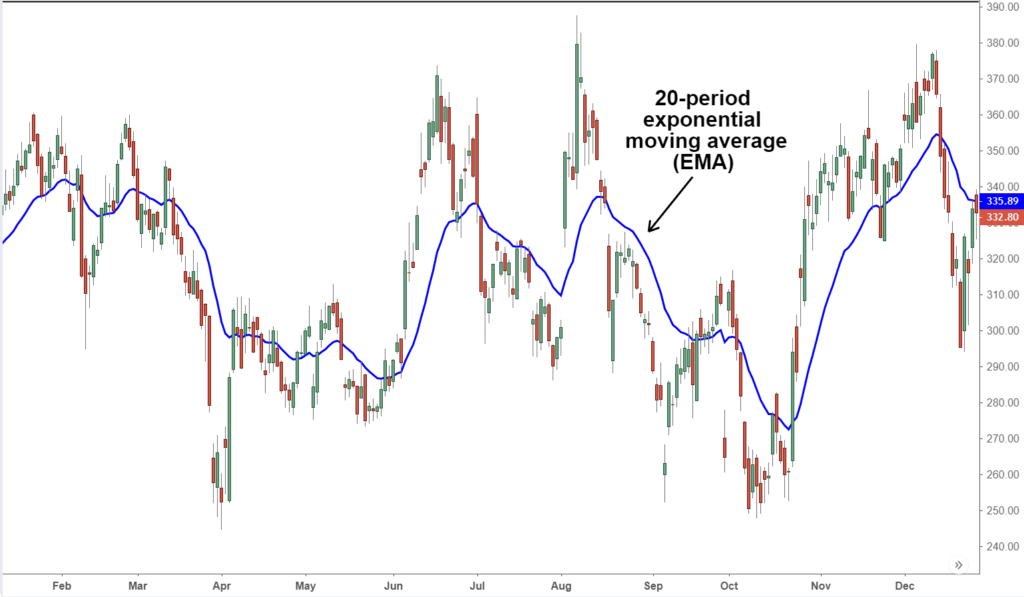 When opting for a long-term strategy, traders usually use between 50 and 200-day indicators.
Crucially, you can use the EMA alongside some of the other indicators on our best forex indicators list to verify noteworthy market moves and measure their validity.
5 – Bollinger Bands
Bollinger Bands are one of the best forex indicators for illustrating the price range the financial asset tends to trade within. Put simply, this indicator is a statistical chart that depicts the volatility and prices of a forex pair over time.
The nearer the ‘bands’ are to one another, the lower the volatility of the instrument is thought to be. Ergo, the further away from each other the bands are, the higher the volatility is thought to be.
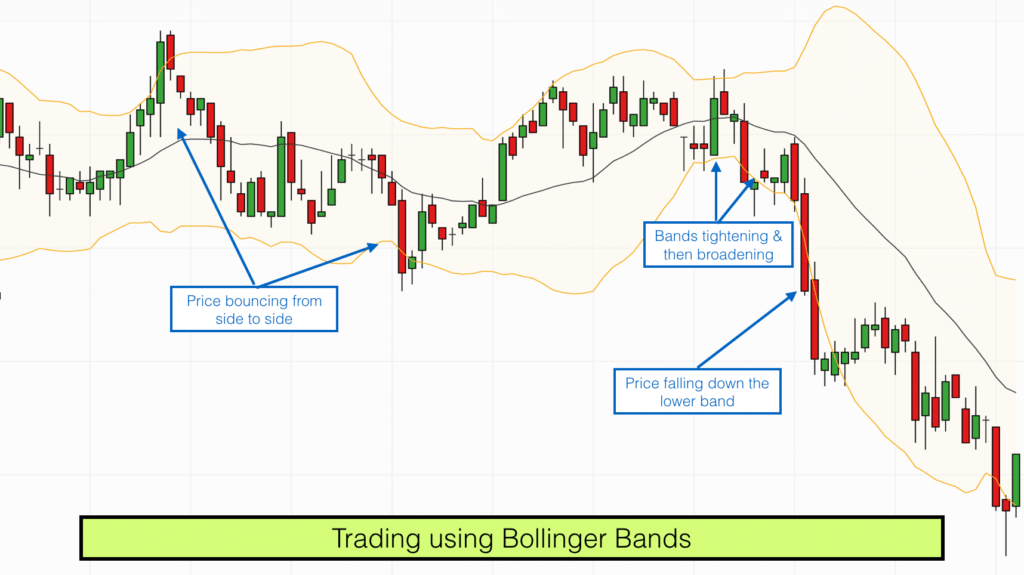
If a price repeatedly shifts above the top band – this indicates the financial asset might be in the ‘overbought’ camp. If the price finds itself underneath the band – this indicates it might be in the ‘oversold’ camp.
Having the tools available to be able to foresee potential overbought or oversold assets is invaluable for predicting when to enter or exit the market.
6 – Ichimoku Cloud
Let’s say you are looking to study historical prices, as well as current price action, in a bid to isolate higher probability trades. In that case, the Ichimoku Cloud could be one of the best forex indicators for the job.
Much like some of the other forex indicators on our list, the Ichimoku Cloud highlights resistance and support levels to forex traders.
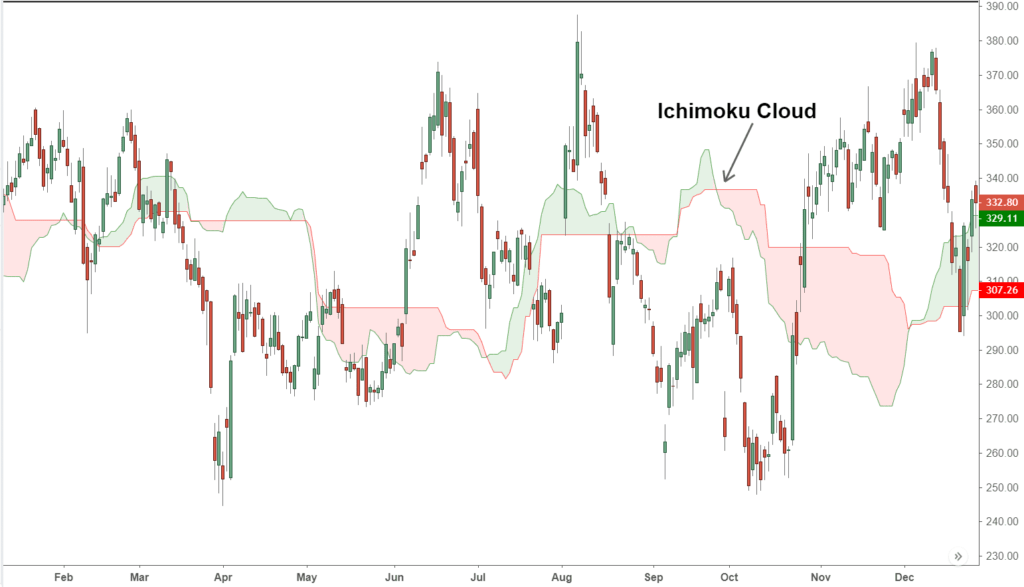
Interestingly, in Japanese ‘Ichimoku Kinko Hyo’ actually translates to ‘one-look equilibrium chart’. As it offers a wide range of information in one place.
The indicator predicts the resistance and support levels of the present and the future. As well as spotting market trends and the direction they may go in.
To clear the mist, you will see below a breakdown of the 5 indicators Ichimoku Cloud indicator is made up of:
- The Senkou Span A: This line tends to be yellow in color and is referred to as ‘leading span A’. Leading span A and is the midway point between Kijun Sen and Tenkan Sen. The line is projected 26 timeframes ahead of time and is calculated – Kijun Sen plus Tenkan Sen, divided by 2.
- The Senkou Span B: This line is often blue in color and referred to as ‘leading span B’. Leading span B is a moving average of the midway point from the previous 52 periods. The line is projected 26 timeframes ahead of time. The calculation goes – 52-period high plus 52-period low, divided by 2.
- The Tenkan-sen: This line is usually the color red and is also referred to as the ‘conversion line’. Tenkan-sen is plotted as a moving average of the midway point of the previous 9 periods.
- The Kijun-sen: This line is normally white in color and referred to as the ‘baseline’. Kijun-sen is plotted as a moving average of the midway point of the previous 26 periods.
- The Chikou Span: This line tends to be green in color and is often referred to as the ‘lagging span’. Plotted 26 periods in the past – senkou span creates the outline of the ‘cloud’. If the senkou span B is below Span A the cloud will be green in color. If A is above B the cloud is generally red in color.
As is evident from above, by reading the Ichimoku Cloud indicator you are able to monitor the ‘weather’ of the markets.
To simplify even further:
- If the cloud is red it is likely there is a bearish trend.
- A green cloud tends to illustrate a bullish trend.
- A slim cloud usually shows you that the current trend is waning.
- The wider the cloud, the stronger the trend tends to be.
7 – Stochastic Oscillator
The stochastic oscillator is classed as a momentum indicator. It draws a comparison between a precise closing price and a range of prices over a particular time frame.
We think the stochastic oscillator is one of the best forex indicators for its strong level of accuracy and simplicity.
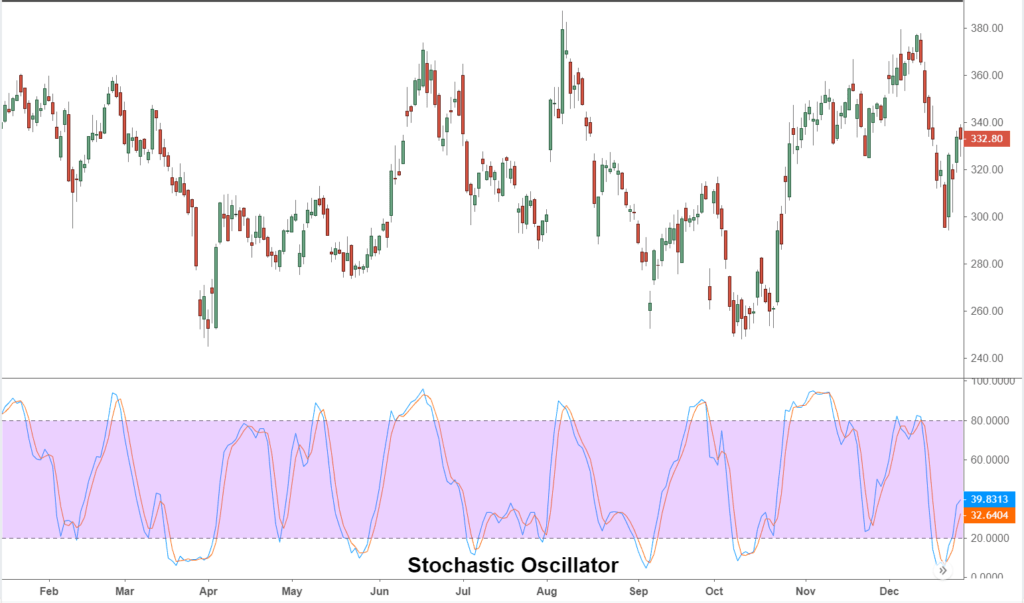
If the reading is over 80 you are looking at a market that falls into the overbought category. If the reading is under 20 – this tends to indicate an oversold market.
Note, if the trend seems to be really strong, it does not necessarily mean that a market correction is imminent so tread with caution. Once again, this is why you should combine multiple forex indicators together to validate your findings.
Nevertheless, the stochastic oscillator offers strong buy and sell signals, which is incredibly useful when trading forex. The forex indicator also works really well alongside the RSI.
8 – Fibonacci Retracement
The Fibonacci retracement makes our best forex indicators list because it helps traders calculate the market ‘pullbacks’ (or temporary pauses in a trend).
Pullbacks often create buying opportunities for traders looking to ride an upward trend. Essentially, the Fibonacci retracement is a drawing tool enabling you to gauge any partial reversals in the markets.
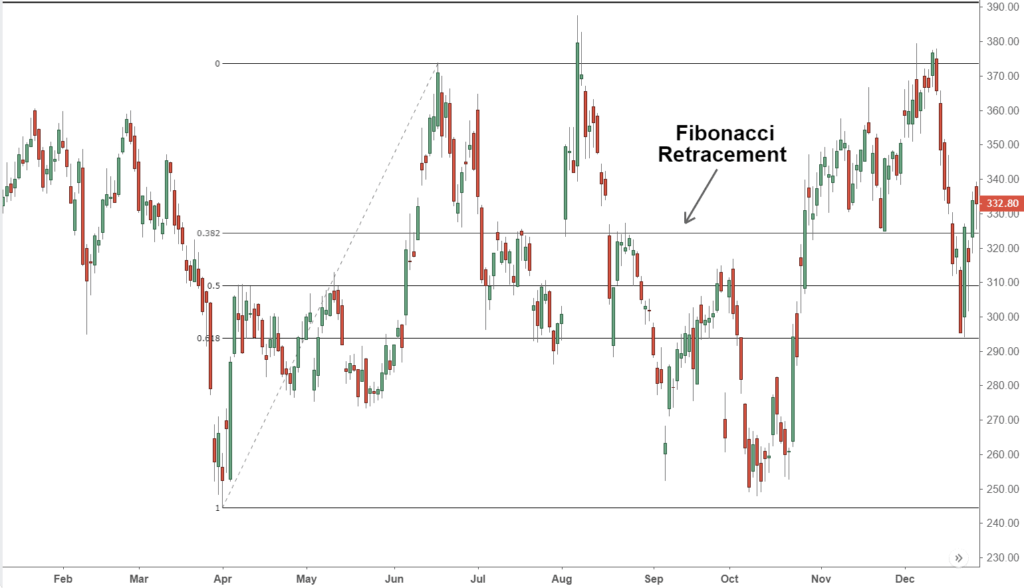 This forex indicator can be used in a variety of different price action phases, achieved by utilizing various retracement levels. Each level measures the number in percentage terms that a market has flipped in between 2 different points.
The indicator levels are usually as follows:
- Between 23.6% and 38.2% for a ‘shallow retracement’ – indicating a quick-moving and strong trend.
- Between 61.8% and 78.6% for a ‘deep retracement’ – strong trending markets, albeit with a lower velocity than a shallow retracement.
You can use Fibonacci retracement between any two important price points – like a high and a low – forging the levels between the 2 points.
It would be better to create a stop-loss order below the previous price shift low of the upward trend – and higher than the previous price shift high of the downward trend.
When there seems to be an upward trend you will be able to utilize the Fibonacci retracement to gauge how much of the last big rally has been let go.
All in all, the Fibonacci retracement is one of the best forex indicators for identifying when to enter the market. You will also have a much better understanding of where is a good point to place ‘stop-loss’ and ‘take-profit’ orders.
9 – Average Directional Index (ADX)
The Average Directional Index, or ADX, is another tool used by many forex traders for establishing the potential strength of a particular trend.
One of the hardest things about trading forex, or any asset, is correctly predicting the direction of a trend. In the ADX, there are 3 indicators including ADX (black), Positive (green), and Negative (red) Directional Indicators.
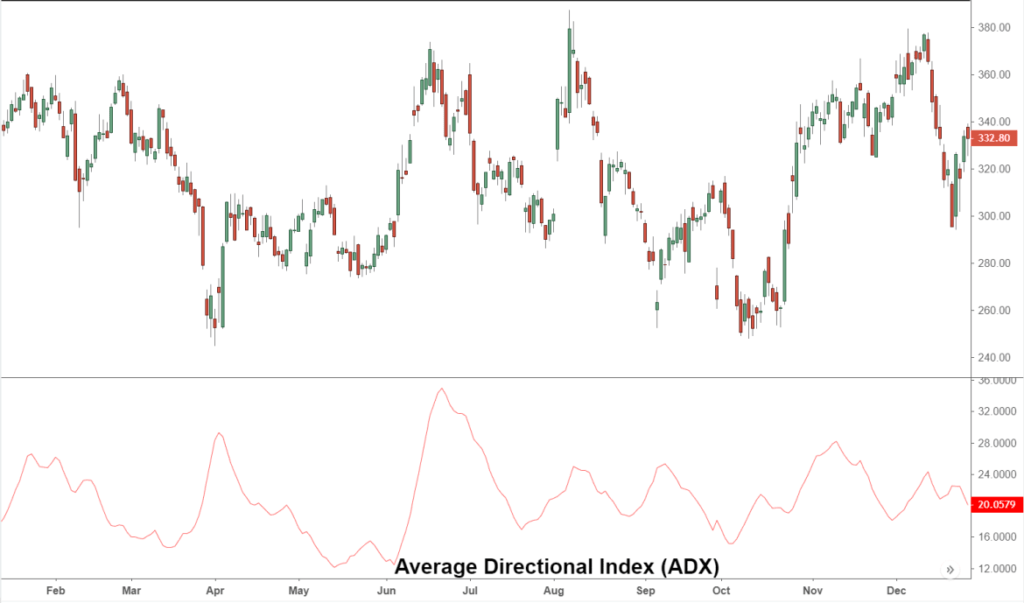
Based on a moving average, and usually spanning over a 14-day timeframe, the ADX concentrates on the strength of a trend – as opposed to its direction. If the green line (positive directional) is above the red (negative directional) – it is likely the trend is strong.
You do not have to set the ADX to a 14-day timeframe. As the chart can be adapted to offer more or less in terms of the price range.
10 – Standard Deviation (SD)
The standard deviation is a calculation of dispersion. The tool made our list of the 10 best forex indicators largely because when used alongside other indicators. It can really help traders to make better-informed choices.
This particular technical analysis tool shines a light on the price volatility of the market. And we think you should include it in your trading strategy.
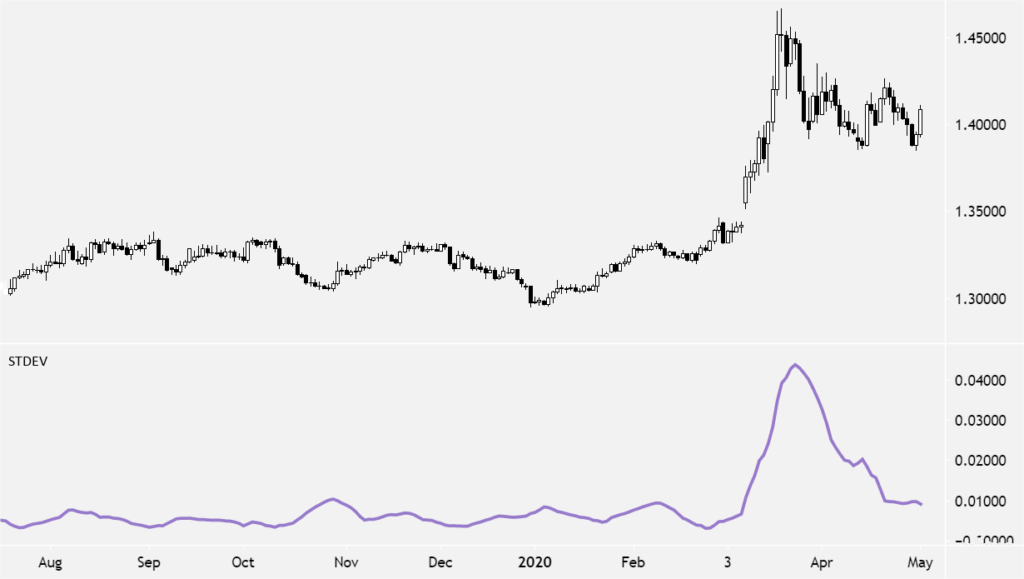 The mathematical formula of the SD will guide you on entering the market at the correct time – not to mention detecting trend reversals and establishing trade targets.
This forex indicator is simple enough for newbies. But powerful for all levels of skill nonetheless. The standard deviation is also a useful tool for better managing your risk/reward.
Please find below a walkthrough of a standard deviation calculation:
- Search the ‘mean closing price’ for the period you are looking at – for example, 20-periods.
- Examine the deviation for every period – this is the closing value minus the average price.
- Search for the square for every deviation – then add those squared deviations.
- Divide the number of deviations by the obtained sum.
- Next, work out the SD as a square root of the value obtained from step 4.
As we said, this indicator calculates how wildly prices have strayed from the average. In terms of timeframe settings, many people opt for the default 20-period setting – sitting between extremes.
With that said, having a forex indicator giving out too many signals can just complicate matters. And thus affect the gains you are able to make.
How to Learn the Best Forex Indicators
If you are feeling a little overwhelmed by the information offered in our best forex indicators guide so far, not to worry.
For as many technical analysis tools there are available to help forex traders, there are hundreds for beginners too. They will help you learn how to use forex indicators effectively.
Try Online Courses
There is an online course on just about any subject these days. Forex indicators are no different.
You can either try an online course specifically for forex indicators or by performing a simple internet search. Crucially, you will find many courses aimed at learning technical analysis in general.
This can help you avoid making the same mistakes as most beginners and diving in with your eyes closed.
Here at Learn 2 Trade, we offer a wide variety of forex courses, including the ultimate trading indicators course – jam-packed with useful information.
Utilize a Demo Account
Another option when it comes to honing in on your skills on forex indicators is to utilize free demo accounts.
For those unaware, most online forex brokers offer clients a free demo account, packed with paper funds.
Each demo account mimics real-world market conditions. And you are able to practice your technical analysis skills until your heart’s content. The best part is, you do not have to risk any of your capital.
When the time comes and you feel ready to start trading forex with real money, you can usually switch to a ‘live account’ very easily.
By which point, you will likely have a much deeper understanding of how to use the best forex indicators to your advantage – as well as having a clear advantage when making trading choices.
Read Educational Books
We all learn differently. People who fall into the ‘kinesthetic’ category, meaning they learn better by ‘doing’, would likely prefer to use a demo account.
However, if you are a linguistic learner, you will more than likely prefer to learn the best forex indicators by reading a book. There are hundreds of forex trading books available at your fingertips
Whether you prefer to read a traditional paper book, digital, or audiobook – there should be a book that tickles your fancy.
To give you a helping hand we have listed some of the best books we found, all of which cover forex indicators and such:
- Technical Analysis Using Multiple Timeframes – by Brian Shannon.
- Bollinger on Bollinger Bands – by John Bollinger.
- Technical Analysis of the Financial Markets – by John Murphy.
- Forex For Beginners – by Anna Coulling.
- Getting Started in Technical Analysis – by Jack Schwager.
- Japanese Candlestick Charting Techniques – by Steve Nison.
- Encyclopedia of Chart Patterns – by Thomas Bulkowski.
- Technical Analysis Explained – by Martin Pring.
As you can see, our best forex indicators guide found that not only are there a plethora of forex trading books aimed at beginners. But you can easily find very specific technical analysis based reads.
Best Forex Indicators 2023: Final Thoughts
In this guide, we have covered the cream of the crop when it comes to forex indicators. Each tool will make a fine addition to any trading strategy.
Anyone who regularly utilizes forex indicators will tell you that technical analysis can take time to get to grips with. However, once you get the hang of it, the information gained is invaluable.
If you are just starting out in the world of trading and are not sure where to begin in learning the best forex indicators, there is help all around you.
Check with your online broker to see if you can access a free demo account. As this can be a good way to get to grips with indicators – in market conditions mirroring real life.
If you are a linguistic learner, you can find heaps of educational material online – including books, and our Learn 2 Trade forex courses which are invaluable for newbies. You can also check out our free forex signals group which is considered to be the best forex signals telegram group on the web. This enables you to learn the ropes from the comfort of your own home.
FAQs
Can I practice using forex indicators for free?
What is the best forex indicator for spotting trends?
Can I get rich using forex indicators?
Can I do a course from home to learn the best forex indicators?
What is the best educational book about forex indicators?
Read more related Articles:
Forex Trading for Beginners: How to Trade Forex and Find the Best Platform 2024


