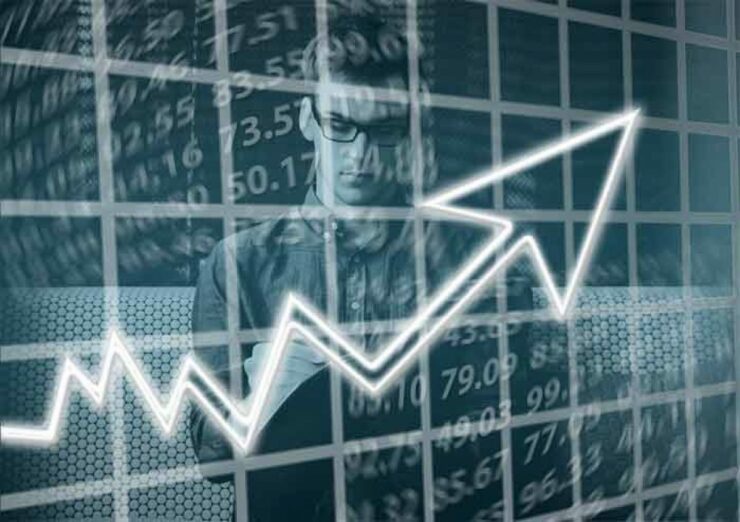
Price action trading and swing trading arena are jam-packed with strategies. While some focus on scalping ultra-small gains, others look at the medium-term. Either way – they all have one thing in common. That is to say, seasoned traders will utilize highly advanced technical indicators and chart reading tools.
Our Forex Signals
1 - month
Subscription
 Up to 15 signals daily
76% success rate
Entry, take profit & stop loss
Amount to risk per trade
Risk reward ratio
Up to 15 signals daily
76% success rate
Entry, take profit & stop loss
Amount to risk per trade
Risk reward ratiomonth
3 - month
Subscription
Up to 15 signals daily
76% success rate
Entry, take profit & stop loss
Amount to risk per trade
Risk reward ratiomonth
 Most popular
6 - month
Subscription
 Up to 15 signals daily
76% success rate
Entry, take profit & stop loss
Amount to risk per trade
Risk reward ratio
Up to 15 signals daily
76% success rate
Entry, take profit & stop loss
Amount to risk per trade
Risk reward ratiomonth
Lifetime
Subscription
Up to 15 signals daily
76% success rate
Entry, take profit & stop loss
Amount to risk per trade
Risk reward ratioSeparate Swing Trading Group
Up to 3 signals weekly
76% success rate
Entry, take profit & stop loss
Amount to risk per trade
Risk reward ratiomonth
1 - month
Subscription
Up to 15 signals daily
76% success rate
Entry, take profit & stop loss
Amount to risk per trade
Risk reward ratiotime
1 - month
Subscription
Up to 15 signals daily
76% success rate
Entry, take profit & stop loss
Amount to risk per trade
Risk reward ratiomonth
3 - month
Subscription
Up to 15 signals daily
76% success rate
Entry, take profit & stop loss
Amount to risk per trade
Risk reward ratiomonth
Most popular
6 - month
Subscription
Up to 15 signals daily
76% success rate
Entry, take profit & stop loss
Amount to risk per trade
Risk reward ratiomonth
Lifetime
Subscription
Up to 15 signals daily
76% success rate
Entry, take profit & stop loss
Amount to risk per trade
Risk reward ratioSeparate Swing Trading Group
Up to 3 signals weekly
76% success rate
Entry, take profit & stop loss
Amount to risk per trade
Risk reward ratiomonth
1 - month
Subscription
Up to 15 signals daily
76% success rate
Entry, take profit & stop loss
Amount to risk per trade
Risk reward ratiotime
However, sometimes it’s best to take a step back and simply look at what is in front of you – the trend. This is known as ‘price action trading’. By going back to the basics – you stand the best chance possible of getting your online trading career off on the right foot.
3
Payment methods
Trading platforms
Regulated by
Support
Min.Deposit
Leverage max
Currency Pairs
Classification
Mobile App
Rating
Total cost
$ 0
![]() Commission
3.5
Commission
3.5
Min.Deposit
$100
Spread min.
Variables pips
Leverage max
100
Currency Pairs
40
Trading platforms
Funding Methods


Regulated by
FCA
What you can trade
Forex
Indices
Actions
Cryptocurrencies
Raw Materials
Average spread
EUR/GBP
-
EUR/USD
-
EUR/JPY
0.3
EUR/CHF
0.2
GBP/USD
0.0
GBP/JPY
0.1
GBP/CHF
0.3
USD/JPY
-
USD/CHF
0.2
CHF/JPY
0.3
Additional Fee
Continuous rate
Variables
Conversión
Variables pips
Regulation
Yes
FCA
No
CYSEC
No
ASIC
No
CFTC
No
NFA
No
BAFIN
No
CMA
No
SCB
No
DFSA
No
CBFSAI
No
BVIFSC
No
FSCA
No
FSA
No
FFAJ
No
ADGM
No
FRSA
71% of retail investor accounts lose money when trading CFDs with this provider.
Rating
Total cost
$ 0
![]() Commission
0
Commission
0
Min.Deposit
$100
Spread min.
- pips
Leverage max
400
Currency Pairs
50
Trading platforms
Funding Methods
Regulated by
CYSECASICCBFSAIBVIFSCFSCAFSAFFAJADGMFRSA
What you can trade
Forex
Indices
Actions
Cryptocurrencies
Raw Materials
Etfs
Average spread
EUR/GBP
1
EUR/USD
0.9
EUR/JPY
1
EUR/CHF
1
GBP/USD
1
GBP/JPY
1
GBP/CHF
1
USD/JPY
-
USD/CHF
1
CHF/JPY
1
Additional Fee
Continuous rate
-
Conversión
- pips
Regulation
No
FCA
Yes
CYSEC
Yes
ASIC
No
CFTC
No
NFA
No
BAFIN
No
CMA
No
SCB
No
DFSA
Yes
CBFSAI
Yes
BVIFSC
Yes
FSCA
Yes
FSA
Yes
FFAJ
Yes
ADGM
Yes
FRSA
71% of retail investor accounts lose money when trading CFDs with this provider.
Rating
Total cost
$ 0
![]() Commission
0.1
Commission
0.1
Min.Deposit
$50
Spread min.
- pips
Leverage max
500
Currency Pairs
40
Trading platforms
Funding Methods
What you can trade
Forex
Indices
Actions
Raw Materials
Average spread
EUR/GBP
-
EUR/USD
-
EUR/JPY
-
EUR/CHF
-
GBP/USD
-
GBP/JPY
-
GBP/CHF
-
USD/JPY
-
USD/CHF
-
CHF/JPY
-
Additional Fee
Continuous rate
-
Conversión
- pips
Regulation
No
FCA
No
CYSEC
No
ASIC
No
CFTC
No
NFA
No
BAFIN
No
CMA
No
SCB
No
DFSA
No
CBFSAI
No
BVIFSC
No
FSCA
No
FSA
No
FFAJ
No
ADGM
No
FRSA
71% of retail investor accounts lose money when trading CFDs with this provider.
In this guide, we show you everything you need to know about price action trading. By the end of reading it, you will have all of the required tools to start trading with the right risk-to-reward ratio in place!
Eightcap - Regulated Platform With Tight Spreads

- Minimum deposit of just 250 USD to get lifetime access to all the VIP channels
- Use our Secure and Encrypted Infrastructure
- Spreads from 0.0 pips on Raw Accounts
- Trade on the Award-Winning MT4 & MT5 Platforms
- Multi-jurisdictional Regulation
- No Commission Trading on Standard Accounts

Price Action Trading
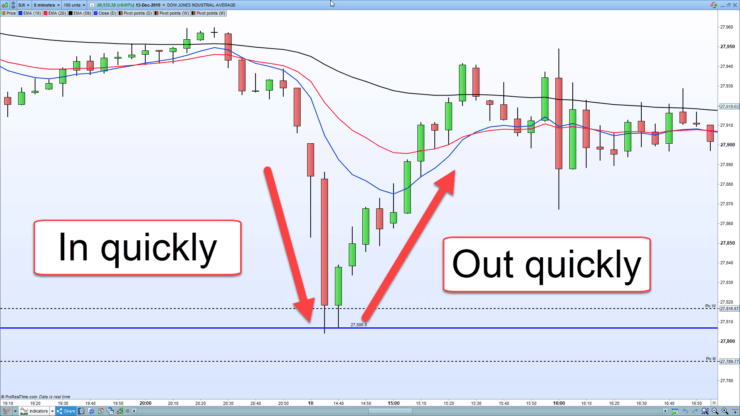
One of the best things about observing the price movement of an asset over a set time is that you’re able to gain lots of useful information such as trade swings, breakouts, and trends – in a productive manner.
Instead of using a technical indicator, or chart recognition – price action trading is all about getting to the basics of trading, so you are better off observing this over a set period as above.
Another form of price analysis is Japanese candle charts – here, rather than an individual price, this will give you a combined view of breaking news based on moves on price.
Price Action Trading is Never Wrong
If you are finding yourself losing money, as a trader, one of your most important jobs is to actively manage the risks by closing the trade if you need to. Billions are transacted daily through markets, by body’s who don’t speculate. As such, it’s not a good idea to speculate and be too reactionary.
As a trader, you can gain a good understanding of risk management, which will be a very valuable step in becoming a much better trader in the future. Price action looks at every capital flow, globally, at all times, comprehensive of what the market’s opinion on your charts currency pair is.
Risk Sentiment – Everything you Need to Know
In a nutshell, the risk sentiment is used to illustrate how the financial markets (those participating) are feeling and acting. What traders decided to sell or buy, is a good indication of how much they are hoping they will make, and how much they are willing to lose.
Risk sentiment is essentially a declaration of how much of a risk the investors and traders are willing to take. The risk assessment is like the common disposition of the financial market as a whole. By familiarizing yourself with the market’s attitude to risk as a whole, this will give you an idea about much risk you might be willing to take with your assets and your money within a specific time frame
They are greed and fear – the financial market can and will play on that.
The vast majority of activity on the financial market is speculated based on the short term, so you are able to quickly exit as well as enter trades. Because of this, we think it’s important to fully understand what risk sentiment is. Crucially, it describes the conduct of investments and traders, and that they might be ‘seeking safety’ or ‘seeking risk’.
What is Risk On?
The financial media often use the term ‘risk-on’ referring to the environment when a market is ‘seeking risk’. When the market is showing signs of lower-than-normal amounts of volatility on price – both up and down – with economic data supporting this, the outlook is considered to be promising – so this means the risk is ‘on’.
When there is ‘risk-on’ conditions, investors and traders feel a lot more optimistic about looking for higher returns, which can mean perhaps selling ‘safe’ assets, or purchasing ‘risky assets’ – which is to turn capital into ‘risky assets’.
Some of the riskiest assets are as follows:
- high yielding currencies (two examples are; Australian dollar and Brazilian real)
- precious metals
- commodities
- and (surprisingly) stocks.
Much like with anything in life, the more of a risk you are comfortable taking, the higher your returns might be. Of course, this also means you risk it going the other way.
What is Risk-Off?
The financial media use the term ‘risk-off’ in reference to the environment when the market ‘seeking safely’.
If the markets are showing high amounts of volatility, and the economic forecast appears to be negative or is deteriorating then the risk is considered to be ‘risk-off’. This means that traders will be less likely to make risky trades.
Big events such as the great financial crisis (2008), geopolitical turmoil (Middle East conflict, ongoing), or more recently the global health crisis COVID-19 (2020) will all have a hugely negative impact on the market – as a result, the market sentiment will become ‘risk-off’.
Traders sometimes become, what’s known as, ‘risk-averse’, when this happens there is a choice of two actions they can execute. Traders can enter positions (buy) within ‘safe-haven assets’, or exit positions (sell) within ‘risky assets’. When the market is particularly harsh, investors and traders will often look for ‘safe havens’, which are a lot more protected, in the event that the economy gets worse.
If you don’t want money as your safe haven, some other options include:
- Swiss franc (CHF)
- US government bonds
- gold (XAU)
- the US dollar (USD)
- Japanese Yen (JPY)
Whereas stocks within the consumer staple and healthcare utility sector are considered a safe haven for the stock traders (otherwise known as ‘defensive assets’).
The reason these sectors are considered safe havens is that irrelevant of the state of the economic landscape, companies operating amongst these sectors provide necessary products that people always need.
Is Risk Sentiment Important?
Yes, risk sentiment is very important, having a basic understanding of this will aid you in managing your emotions and risk, and will help you in preserving your capital. The markets will frequently shift up and down on a daily or weekly basis, this is a good indication of changes in risk sentiment – this should help you have a better comprehension of why the market is functioning the way it is.
Risk sentiment can shift gradually, or sometimes at a rapid rate. This knowledge or even basic grasp of risk sentiment is going to help you to decipher the financial news, economic data, and remain calm in the face of fluctuation. Markets can sometimes quickly switch to ‘risk-off’ mode, after being ‘risk-on’ for days, or sometimes months. Checking out the market news by using risk sentiment is going to help you to make sense of the perplexity and vagueness of events in market news.
Something else which can often have a major effect on the risk sentiment is a worse than expected negative result. This is an economic environment data release (like NFP) referring to a declining sector or marketplace.
Capital will move to safe-haven assets, from risky – and the risk sentiment changes to ‘risk-off’, from ‘risk-on’. As soon as the markets move to ‘risk-off’ mode the vultures will be on the prowl, selling off risky assets and holding onto safe-haven assets. In the worst-case scenario, prices will fall, and fast – the best-case scenario is that your price action trading will be restrained, stopping any major upside.
Measuring Risk Sentiment
To ensure you are able to fully appreciate the impact of risk sentiment, below we list some of the key metrics that you need to look out for when trading in live market conditions – irrespective of whether you are in a ‘risk-off’ or ‘risk-on’ environment.
Volatility Index
Otherwise known as VIX; this measures specific markets relative to instability, as well as the probability of making an unexpected or sudden movement in price.
VIX will help you understand the level of risk (whether on or off) in stocks. The VIX Index is also commonly referred to as the ‘fear index’ or ‘fear gauge’. It is also used to determine the market’s level of anxiety by stock traders and options traders. As such, this is one of the most commonly known indexes of volatility on the market as a whole.
- The lower the VIX, the less the market will have to fear, the higher the VIX, the more the market will fear.
Market expectations of volatility moving forward are measured in the S&P Index. FOo example, if VIX is giving out a value of under 20, that is widely considered to be calm, whereas a value of more than 30 is seen as volatile.
U.S. Stock Index
This market index is one of the clearest of the real-time barometres to keep an eye on.
Amongst the most broadly observed U.S indexes are;
- NASDAQ Composite
- S&P 500
- DJIA (Dow Jones Industrial Average)
These indexes are indicators for the entire global economy, not just the U.S.
You can find reports on the direction of these indexes, several times a day by tuning into financial media outlets such as Bloomberg and CNBC. When the stock indexes are referred to as being ‘down’, this means the risk if ‘off’, on the other hand when they are ‘up’, the risk is ‘on’.
U.S Government Bonds
Referred to as U.S Treasuries, the U.S. Treasury Department will issue its bonds all year round. Thee bonds will be issued in order to raise cash in order to finance daily operations or projects. When it comes to investments, U.S Treasuries are considered to be as near to risk-free as you can get, which is why they are often thought of as being safe-haven assets.
There are 3 kinds of fixed-income securities which are used to fund operations by the U.S government, these are:
- Treasury bonds
- Treasury bills
- Treasury notes.
Every one of them pays interest in a different way, and each has a contrasting maturity rate, this can be anywhere from four weeks to sometimes thirty years. To keep you informed, you will find reports on the yields of each of these will be reported on in financial media.
When the yields are up, you can be sure the market is selling U.S government debt. This is because by doing this the prices will fall, meaning they improve their yield. When a risk-free asset like this is being sold, it generally means they are feeling positive about it, so the risk sentiment changes from ‘risk-off’ to ‘risk-on’.
If on the other hand yields are down, the opposite is true, the risk will likely change to ‘risk-off, because it’s a sign of fear, on account of the market buying government debt instead. It forces prices to rise, which in turn will decrease the yield.
Safe Haven Currencies
Safe haven currencies react quickly to risk sentiment shifts, given that they are so super sensitive to such changes – these currencies are anticipating for the value to increase, or maintain its value in the ‘risk-off’ environment.
You will be able to keep an eye on risk sentiment 24 hours a day because unlike the U.S stock market, the forex space is open 24/7.
Swiss Franc (CHF)
The Swiss franc (CHF) is very strong. Even though the global financial markets have encountered many a crisis in years gone by, Switzerland maintains a firm hold.
CHF is a safe haven currency due to a steady economy, political stability and sound monetary and fiscal policy. International investors have even been known to turn to Switzerland in times of financial crisis.
A sure sign that there is a market disturbance (usually in Europe), is when the CHF is stronger than high yielding currencies. This will usually lead currency traders to escape to the supposed safety of the CHF.
This action illustrates a ‘risk-off’ environment.
U.S Dollar (USD)
This is a good example of ‘risk-off’ sentiment, due to the strength of the USD. If the news reports that the USD is stronger than the high yielding currencies, by all accounts, the market would be displeased with the recent financial news and economic data.
This would normally result in markets seeking the USD as a safe haven. For you to be able to buy U.S treasuries as your safe haven, you will definitely need to buy some USD (if you don’t already have some). The USD value will arise when a number of investors do this simultaneously.
Japanese Yen (JPY)
This is another example of a ‘risk-off’ sentiment. So, if the report is saying that the Japanese Yen is stronger than high yielding currencies – again, markets might be displeased with the data or news, and likely seek JPY as a safe haven (especially if the news is in relation to the USD).
Two of the currency pairs it’s good to keep an eye on our NZD/JPY and also AUD/JPY. Crucially, these two pairs are hugely popular ‘carry’ trades (this would be referred to as a risk on strategy). Sudden drops in these two currency pairs can be a sign of risk aversion.
With so much unpredictability in the world right now, there will generally be a flee to safety, perhaps to USD, JPY and CHF. When NZD/JPY and AUD/JPY are o the rise, this is a clear sign that the risk assessment is now ‘risk-on’
Nothing is 100% Risk-Free
We’re sorry to break it to you, but it has to be said that, much like unicorns, a 100% risk-free asset does not exist. There is no asset which will be permanently safe and it is absolutely impossible to be 100% ‘risk-off’.
When it comes to cold hard cash, unfortunately, you still face the risk of your purchasing power being gradually eroded by inflation. That risk will always exist – In fact ‘risk-on’ and ‘risk-off’ are merely expressions to describe the disposition of the market.
Technical Analysis
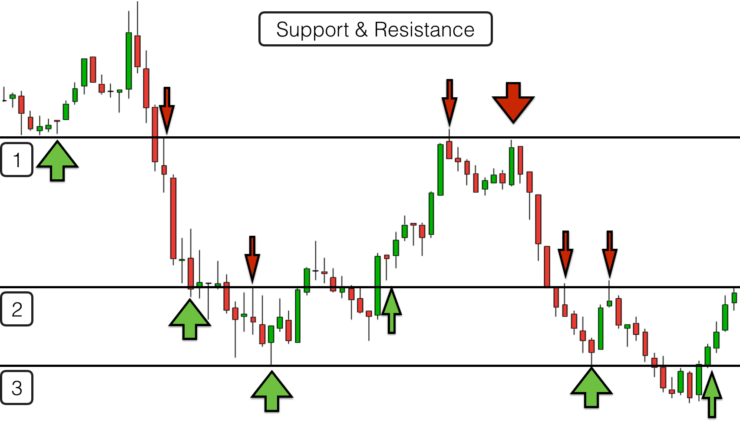
So that it can predetermine patterns and identify what might happen in the future, technical analysis is the study of price actions in history. In order to determine patterns and the possibility of future movements. Technical Analysis uses the price chart as a way to predetermine momentum, support and resistance. This aids traders in entering and exiting trades which have a higher probability.
The big difference between fundamental analysis and technical analysis is that technical analysis can use historical volume and price data, whereas fundamental analysis cannot. Technical analysis focuses its attention on the future, so analysing the history of price actions puts it in great stead for predicting price movements and trading habits of the future.
It is widely believed amongst forex traders who frequently use technical analysis, that price patterns will usually tend to repeat themselves further down the line. This enables them to examine a currency pair and price movements it has made in the past – this information will be looked at when making the decision to exit or enter a position.
The main premise for technical analysis is that rather than concentrating on the statistical analysis of the price movements, the price of an asset can reflect the information already available. The analysis of the market’s supply and demand will dictate which direction the price trend will go.
The main hypothesis of technical analysis are as follows:
- Traders can see whether or not selling interest, or buying interest is increasing or decreasing.
- You are able to conclude what you think participants in the market might plan on doing next
- You have a better understanding of what sellers and buyers might be thinking, due to recent price developments observed.
The technical analysis is based on these three principles:
- Trends and price moves
- The ‘fundamentals’, or macroeconomic conditions will automatically be factored into the currency pair price. The market marks down everything. Events like employment reports and interest rates will be included in the price automatically, because of buyers and sellers within the market.
- It’s often thought that with pricing trends, history is a good indication of what is to come, and so they often come back around.
Technical Analysis Goals
- To observe statistics and any market patterns emerging, and to profit from trading.
- When the market starts to shift, technical analysis will know when to enter or exit the market.
- To make sound decisions on trading, without emotional consideration.
So, the long and short of it is, that technical analysis will identify a trend, followed by the support and resistance of the market. This is by using time frames, or price charts.
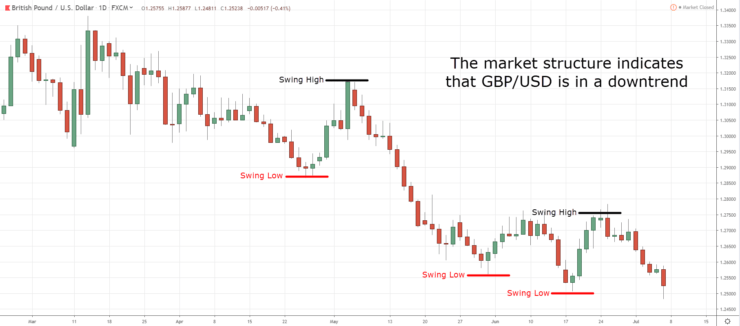
Essentially, when it comes to markets, they can only have three options – move down, move up, or move sideways. Generally speaking, prices will move in a zig-zag, because of this price action only has 2 states:
- Trend: Prices zig-zag lower on a downtrend or higher on an uptrend.
- Range: Prices zig-zag to aside.
Technical analysis use three kinds of tools and techniques:
- Technical Indicators: buying and selling signals, with the use of statistical tools.
- Chart Patterns: Predicting where prices are headed by spotting major chart patterns.
- Price Action: Drawing chart lines etc to identify what direction the market is going in, and this is done by examining past price movements.
So that begs the question – is technical analysis actually important? In the next section, we explore this sentiment further.
Is Technical Analysis important?
Yes, it is. Technical analysis can not only help you decide where and when to get out of a trade but also where or when to enter it.
By identifying patterns of the past which are likely to repeat, technical analysis is a very helpful tool when it comes to identifying possible probabilities and choosing trades with good odds.
It is very difficult to stay profitable all of the time as it is, but without the use of risk management, we would say it’s near impossible.
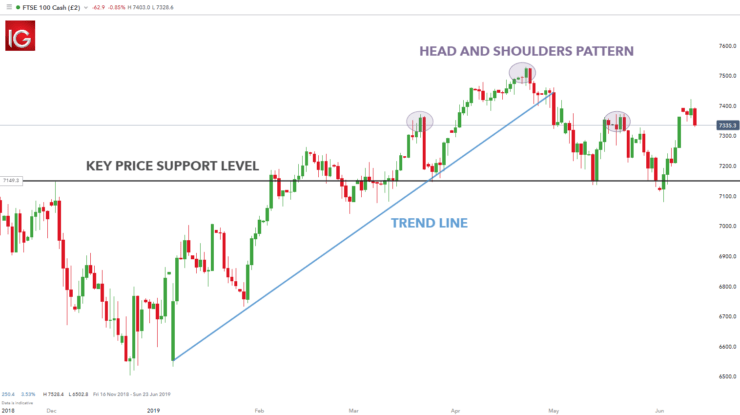
Chart Pattern
Chart patterns are the essence of technical analysis; using a number of curves or lines, the chart pattern is a graphical display of price movement. Factors such as human behaviour can cause fluctuations in the cost of a financial asset, and these patterns are the basis of technical analysis and help identify trend movements with the price of an asset.
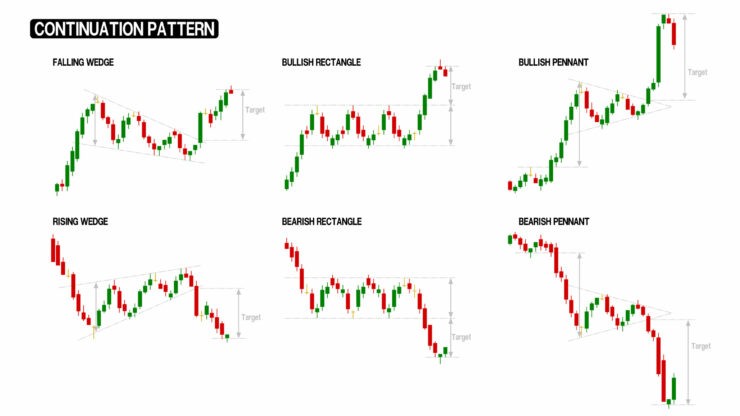
It is worth noting that patterns can be formed on any amount of time from seconds to months, sometimes ticks will be added to a bar, line or candlestick chart. The chart pattern isn’t based on science or physics, their success highly relies upon the number of participants in the market taking notice of them.
The two chart pattern types available are as follows:
- Continuation Chart Patterns: Common continuation patterns include flag patterns, pennant patterns, and triangle patterns – This pattern helps traders to establish opportunities so that they can continue the trend.
- Reversal Chart Patterns: A common phrase used is “the trend is your friend until it blends”. Reversal patterns try to find where trends finished, so completely the opposite of continuation patterns. The aim here is to find possibilities to trade on the reversal of a certain trend.
A few of the most commonly used reversal patterns include:
- triple top
- triple bottom
- head and shoulders
- head and shoulders
- double bottoms
- double tops.
These patterns work so well due to the fact chart patterns work across a variety of time frames, as they are factual (a recurring pattern, in amongst larger price movements).
The general consensus of technical traders is that the price shows all of the essential information such as perceived fair value, as well as market sentiment. Chart patterns study every asset class, from currencies, stocks, bonds and commodities to cryptocurrencies.
Chart Pattern Psychology
Market psychology is a driving force for chart patterns. All prices and their formations are reflected by the selling and buying pressures (using a pictorial guide). The residing force that plays a big part in shaping these prices is of course supply and demand.
The universal laws of supply and demand and emotion mean that it doesn’t matter what time frame you decide to trade the chart patterns with, this is because the orders will be put forward by human beings.
Here we have listed the three leading steps to a top-down approach to trading chart patterns:
- When making a decision on which time frame you would like to trade on, always be mindful of what kind of trader you are.
For instance, the daily chart, and 4hr can be used to scalp the market, or for swing trading.
5 and 15-minute intraday charts are generally used for scalping the market, and day trading.
The weekly – monthly time frame is good for position trading
- Depending on your chosen time frame, you should identify the dominant trend for that time frame.
- When you’ve spotted a dominant trend, you can then identify chart patterns in order to time the market.
Never trade purely based on chart patterns, not unless you have a framework which is established as the last thing you want is to end up trading based solely on your emotions.
Trading Books Description and Listing
If you wish to educate yourself further on price action trading, we’ve compiled a helpful list of books that we think are all a must-read.
🥇 Trading for a living: Phycology, Trading, Tactics, Money Management – by Alexander Elder
This book is heavily influenced by the 3 M’s; money, mind, and method. With ‘trading for a living’ you can master all three.
This book is great for disciplining your mind, explaining trading market methods, and guides you on how to better manage the money in your trading accounts.
🥇 Come Into My Trading Room: A Complete Guide to Trading – by Alexandar Elder
Dr Alexander covers everything from the overall management of time, strategy and trading money, to spotting indicators that could potentially lead to consistent profit.
From trading basics to phycological tactics, this book aims to make any average joe into a successful trader.
🥇 Trading in the Zone: Master the Market with Confidence, Discipline, and a Winning Attitude – by Mark Douglas
The author of this book, Mark Douglas, is a highly astute trader, industry consultant, and trading coach.
There are five main issues this book covers, in order to give traders a better understanding of themselves and the way they trade. The aim here is to help traders when it comes to selecting stock, myths about the market, and hopefully increase profitability
🥇 Trade Your Way to Financial Freedom – by Van K. Tharp
This is a realistic view of how to trade in the market, with a great explanation of common traps, to tips on being a successful trader, this book is a very informative read.
In no particular order, the main focuses of the book are as follows: How to create your own system, how to be open-minded, exit strategies and positive expectancy.
🥇 Japanese Candlestick Charting Techniques – by Steve Nison
Steve Nison has years of experience in this ever-popular form of technical analysis. Featuring everything from constructing candlesticks and understanding the patterns to a variety of technical techniques, this book is a very educational read.
This is the 2nd edition, and explains everything in Layman’s terms for those of you who wouldn’t know where to start with candlestick charts!
Best Brokers and Platforms for Price Action Trading
If you’ve managed to make it this far – you should now have a firm grasp of what price action trading is, and why so many seasoned traders swear by it as both a short and long-term strategy.
As such, the final piece of the puzzle is to find an online broker that you can utilize your newly learned price action trading strategy with. Below you will find five platforms in particular – all of which offer heaps of asset classes, low fees, and a stringent regulatory framework.
1. AVATrade – 2 x $200 Welcome Bonuses
AVATrade is a great option if you are looking to practice price action trading. The broker offers full support for MT4 - which you can use via the platform's demo account. Then, when you are ready to trade in live market conditions, you can proceed to open a real money account.
AVATrade does not charge any trading commissions, and spreads are super low. In fact, you can trade major forex pairs at spreads of just 0.9 pips, which is very competitive. Best of all, new customers are offered a welcome package just for signing up!
- 20% welcome bonus of up to $10,000
- Minimum deposit $100
- Verify your account before the bonus is credited
2. VantageFX – Ultra-Low Spreads
VantageFX VFSC under Section 4 of the Financial Dealers Licensing Act that offers heaps of financial instruments. All in the form of CFDs - this covers shares, indices, and commodities.
Open and trade on a Vantage RAW ECN account to get some of the lowest spreads in the business. Trade on institutional-grade liquidity that is obtained directly from some of the top institutions in the world without any markup being added at our end. No longer the exclusive province of hedge funds, everyone now has access to this liquidity and tight spreads for as little as $0.
Some of the lowest spreads in the market may be found if you decide to open and trade on a Vantage RAW ECN account. Trade using institutional-grade liquidity that is sourced directly from some of the top institutions in the world with zero markup added. This level of liquidity and availability of thin spreads down to zero are no longer the exclusive purview of hedge funds.
- The Lowest Trading Costs
- Minimum deposit $50
- Leverage up to 500:1
Conclusion
In summary, price action trading smashes much of the literature books to pieces – as it attempts to take you back to the basics. That is to say, the theory teaches simplicity – insofar that you pay attention to what is happening in the here and now – as opposed to focusing exclusively on the past.
As such, we hope that by reading our guide in full, you now have a firm grasp of what price action trading is, and why it is crucial to master in the long run.
AvaTrade - Established Broker With Commission-Free Trades
- Minimum deposit of just 250 USD to get lifetime access to all the VIP channels
- Awarded Best Global MT4 Forex Broker
- Pay 0% on all CFD instruments
- Thousands of CFD assets to trade
- Leverage facilities available
- Instantly deposit funds with a debit/credit card
FAQs
What type of trading is price action trading suitable for?
Should I still learn technical analysis?
What assets it price action trading relevant to?
Is price action trading suitable for beginners?
Where can I learn more about price action trading?
Is price action trading only for entering the market?
Is price action trading still effective?