In 2026, the best price action trading PDF is available. Experienced traders utilize state-of-the-art technical indicators and sophisticated chart-reading tools. While some focus on smaller short-term gains, others prefer to think further ahead.
Our Forex Signals
1 - month
Subscription
 Up to 15 signals daily
76% success rate
Entry, take profit & stop loss
Amount to risk per trade
Risk reward ratio
Up to 15 signals daily
76% success rate
Entry, take profit & stop loss
Amount to risk per trade
Risk reward ratiomonth
3 - month
Subscription
Up to 15 signals daily
76% success rate
Entry, take profit & stop loss
Amount to risk per trade
Risk reward ratiomonth
 Most popular
6 - month
Subscription
 Up to 15 signals daily
76% success rate
Entry, take profit & stop loss
Amount to risk per trade
Risk reward ratio
Up to 15 signals daily
76% success rate
Entry, take profit & stop loss
Amount to risk per trade
Risk reward ratiomonth
Lifetime
Subscription
Up to 15 signals daily
76% success rate
Entry, take profit & stop loss
Amount to risk per trade
Risk reward ratioSeparate Swing Trading Group
Up to 3 signals weekly
76% success rate
Entry, take profit & stop loss
Amount to risk per trade
Risk reward ratiomonth
1 - month
Subscription
Up to 15 signals daily
76% success rate
Entry, take profit & stop loss
Amount to risk per trade
Risk reward ratiotime
1 - month
Subscription
Up to 15 signals daily
76% success rate
Entry, take profit & stop loss
Amount to risk per trade
Risk reward ratiomonth
3 - month
Subscription
Up to 15 signals daily
76% success rate
Entry, take profit & stop loss
Amount to risk per trade
Risk reward ratiomonth
Most popular
6 - month
Subscription
Up to 15 signals daily
76% success rate
Entry, take profit & stop loss
Amount to risk per trade
Risk reward ratiomonth
Lifetime
Subscription
Up to 15 signals daily
76% success rate
Entry, take profit & stop loss
Amount to risk per trade
Risk reward ratioSeparate Swing Trading Group
Up to 3 signals weekly
76% success rate
Entry, take profit & stop loss
Amount to risk per trade
Risk reward ratiomonth
1 - month
Subscription
Up to 15 signals daily
76% success rate
Entry, take profit & stop loss
Amount to risk per trade
Risk reward ratiotime
Sometimes it can be hard to see the wood for the trees, so it might be beneficial for you to take a step back and reevaluate the trends. Put simply, this is price action trading.
3
Payment methods
Trading platforms
Regulated by
Support
Min.Deposit
Leverage max
Currency Pairs
Classification
Mobile App
Rating
Total cost
$ 0
![]() Commission
3.5
Commission
3.5
Min.Deposit
$100
Spread min.
Variables pips
Leverage max
100
Currency Pairs
40
Trading platforms
Funding Methods


Regulated by
FCA
What you can trade
Forex
Indices
Actions
Cryptocurrencies
Raw Materials
Average spread
EUR/GBP
-
EUR/USD
-
EUR/JPY
0.3
EUR/CHF
0.2
GBP/USD
0.0
GBP/JPY
0.1
GBP/CHF
0.3
USD/JPY
-
USD/CHF
0.2
CHF/JPY
0.3
Additional Fee
Continuous rate
Variables
Conversión
Variables pips
Regulation
Yes
FCA
No
CYSEC
No
ASIC
No
CFTC
No
NFA
No
BAFIN
No
CMA
No
SCB
No
DFSA
No
CBFSAI
No
BVIFSC
No
FSCA
No
FSA
No
FFAJ
No
ADGM
No
FRSA
71% of retail investor accounts lose money when trading CFDs with this provider.
Rating
Total cost
$ 0
![]() Commission
0
Commission
0
Min.Deposit
$100
Spread min.
- pips
Leverage max
400
Currency Pairs
50
Trading platforms
Funding Methods
Regulated by
CYSECASICCBFSAIBVIFSCFSCAFSAFFAJADGMFRSA
What you can trade
Forex
Indices
Actions
Cryptocurrencies
Raw Materials
Etfs
Average spread
EUR/GBP
1
EUR/USD
0.9
EUR/JPY
1
EUR/CHF
1
GBP/USD
1
GBP/JPY
1
GBP/CHF
1
USD/JPY
-
USD/CHF
1
CHF/JPY
1
Additional Fee
Continuous rate
-
Conversión
- pips
Regulation
No
FCA
Yes
CYSEC
Yes
ASIC
No
CFTC
No
NFA
No
BAFIN
No
CMA
No
SCB
No
DFSA
Yes
CBFSAI
Yes
BVIFSC
Yes
FSCA
Yes
FSA
Yes
FFAJ
Yes
ADGM
Yes
FRSA
71% of retail investor accounts lose money when trading CFDs with this provider.
Rating
Total cost
$ 0
![]() Commission
0.1
Commission
0.1
Min.Deposit
$50
Spread min.
- pips
Leverage max
500
Currency Pairs
40
Trading platforms
Funding Methods
What you can trade
Forex
Indices
Actions
Raw Materials
Average spread
EUR/GBP
-
EUR/USD
-
EUR/JPY
-
EUR/CHF
-
GBP/USD
-
GBP/JPY
-
GBP/CHF
-
USD/JPY
-
USD/CHF
-
CHF/JPY
-
Additional Fee
Continuous rate
-
Conversión
- pips
Regulation
No
FCA
No
CYSEC
No
ASIC
No
CFTC
No
NFA
No
BAFIN
No
CMA
No
SCB
No
DFSA
No
CBFSAI
No
BVIFSC
No
FSCA
No
FSA
No
FFAJ
No
ADGM
No
FRSA
71% of retail investor accounts lose money when trading CFDs with this provider.
In this price action trading PDF, we will explain everything there is to know about the trading strategy. Whether you are looking to trade forex, stocks, cryptocurrencies, or gold – we hope that this guide will help you to gain a much more in-depth understanding of price action trading. That way, you will be armed with all of the knowledge you need to begin trading like a pro!
Learn 2 Trade Free Signals Service
- Get 3 Free Signals per Week
- No Payment or Card Details Needed
- Test the Effectiveness of our High-Level Signals
- Major, Minor, and Exotic Pairs Covered
What is Price Action Trading?
Price action trading is analysing breakouts, trade swings and trends of a price, over a certain period of time. This is a very productive way of gaining practical information about the asset price movement.
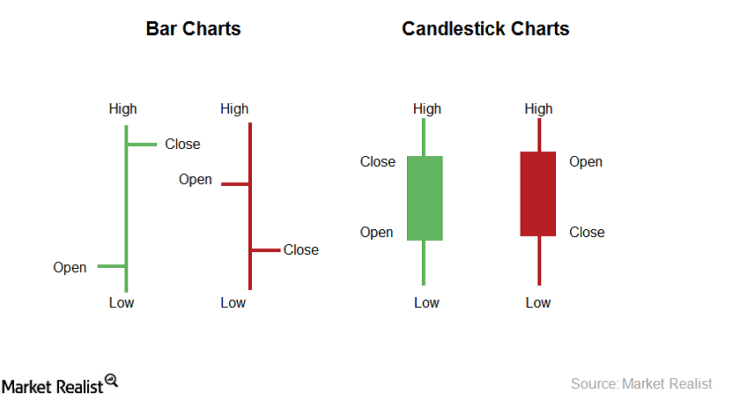
Instead of just being able to assess an individual price, the strategy looks for a consolidated view of price movement – as and when it happens. As an example, you can also look at the Japanese candle charts to gain a birds-eye overview of this.
Price Action Trading is Always Right
As a trader, when you start to see a loss, the first thing you should be doing is to actively control your risk. This means closing a trade as and when you see fit – irrespective of whether you are in the red or green.
Try not to make too many assumptions or irrational decisions. Crucially, billions of dollars are bought and sold on a daily basis through markets, by entities which do not speculate.
A significant step towards becoming a great trader is to familiarise yourself with risk management. Further down this price action trading PDF, we will be explaining this in much greater detail.
What is Risk Sentiment?
Put simply, risk sentiment shows the feeling and position of the participating financial markets. A good way of indicating how much traders are willing to lose, or how much they expect to make, is studying what they have decided to buy or sell. Risk sentiment is basically a presentation of the level of risk which traders and investors are inclined to take. This risk evaluation is basically the common inclination of the entire financial market.
Making yourself aware of the wider financial markets’ position on risk will provide you with a lot more insight into the amount of potential risk you are prepared to take when it comes to your money and assets (within a certain time frame).
The lion’s share of action on the financial market is assumed with the short term in mind. This, of course, means that you can swiftly enter trades, and exit when the timing is right. Again this is just one of the reasons you should have a good understanding of what risk sentiment means. Ultimately, this depicts the behaviour of traders and investors and tells you whether they are likely to seek safety or seek risk.
Risk On – What is it?
The expression ‘risk-on’ will be used to describe a particular market which is seeking risk. If there is a ’risk-on’ environment; traders and investors will be more positive in searching for higher returns. In some cases, this could result in buying ‘risky-assets’, or indeed selling ‘safe-assets’ – This is essentially changing capital into ‘risky-assets’.
Below you will find a handful of the most assets that fall within the remit of ‘risky’ (with a level of price volatility):
- Precious metals
- Stocks
- High yielding currencies, such as the South African rand or the New Zealand dollar
- High yielding bonds
- Real Estate
- Commodities
The lower the risk you take, the lower your returns will be – but of course the higher the risk, the higher your returns will be. Every action has a reaction.
Risk-Off – What is it?
When the market is ‘seeking safety’ the financial media will likely use the phrase ‘risk off’. In the case of a ‘risk-off’ environment, it is highly unlikely that traders will make trades which are risky. Another example of ‘risk-off’ is when a market is displaying high volatility, as well as the economic forecast seemingly declining. Huge global events can have a massive adversary impact on the market, and thus – this will make the market sentiment ‘risk-off’.
Some of the biggest impacts on the market have been COVID-19, the huge health crisis sweeping the world, the conflict in the Middle East and also the great financial crisis of 2008. Every now and again traders might come to be ‘risk-averse’, meaning they are reluctant to take risks. In this instance there are usually two different moves they are able to make, these are:
- Traders might buy (enter position) ‘safe-haven’ assets
- Traders might sell (exit position) ‘risky-assets’
Investors might search for a ‘safe-haven’ when it comes to a market which is especially harsh. This is due to the fact that they will be a lot more secure just in case the economy does get worse. Cold hard money is thought to be one of the best safe-havens around. In times of financial fear and uncertainty, investors and traders often turn any capital into ‘safe-haven’ assets. This is because the ‘low-risk’ assets offer lower rewards, but this is offset by less risk.
The idea behind this is to create a ‘risk-aversion’, in order to protect capital. If, like many, you are not interested in your local currency as your ‘safe-haven’ then here are some other alternatives for your consideration:
- Gold
- Swiss franc
- US dollar
- US Treasuries
- Japanese Yen
The main reason the above financial instruments are thought of as ‘safe-havens’ is because no matter what state the economic environment is in, the said instruments mentioned will always supply an essential value that people are always going to require.
Some within the financial spaces would argue that stocks in the healthcare utility sector, as well as the consumer staple sector, are defensive assets – otherwise referred to as ‘safe-havens’ for stock traders.
Why is Risk Sentiment so Important?
Having a good grasp on how risk sentiment works will help you to preserve your capital by managing any risk and emotion involved. So with this in mind, this section of the price action trading PDF will be risk sentiment focused. To give you a good idea of why a market might be behaving the way it is, you should study the risk sentiment. Markets will go up and down, fluctuating daily, and this will all be reflected in the risk sentiment.
In order to make sense of economic data and the latest financial news, your understanding of risk sentiment should help you to avoid a financial panic in the face of instability. Sometimes risk sentiment changes at a slow rate, sometimes expeditiously. From time to time a market might be ‘risk-on’ for a number of days or even months, and then all of a sudden change to ‘risk-off’ mode.
 But by utilising risk sentiment, whilst keeping an eye on the market news, you stand a much better chance of understanding the ambiguity and complexity sometimes reported in the financial media. When there’s a disappointing economic data release with regards to improving the economic landscape, there may be little to no change to the risk sentiment.
When an economic environment data is released and it leans towards a diminishing marketplace, sector or economy, this can have a huge effect on the risk sentiment and is considered a very discouraging result. The bearing of the news makes a big difference to the change in risk sentiment, and in that case, the market could just ignore the data published and continue to buy risky assets regardless!
When the market changes to ‘risk-off’ mode, this is when the seasoned trader might sell off any risky assets, but hold on tight to ‘safe-haven’ assets. This could lead to your price action trading being restrained, which would prevent any significant upside. Of course, there is also a chance that the prices will start falling at a rapid rate.
With that in mind, the next section of our price action trading PDF looks at how to measure risk sentiment.
How to Measure Risk Sentiment?
Regardless of whether or not you are in ‘risk-on’ or ‘risk-off’ conditions, when you are trading within the ‘live market’ you need to keep an eye out for some of the key metrics (see below). They will be very helpful when it comes to understanding the risk sentiment and the impact of it can have.
US-Based Stock Indices
Out of all of the real-time points of reference to keep a careful eye on, the market indices in the US is one of the most transparent there is.
Some of the most widely scrutinised US indices are as follows:
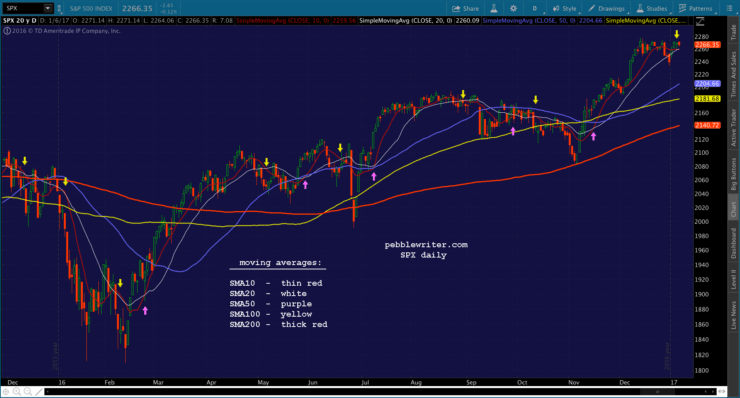
- S&P 500 (Standards and Poor, stock market index)
- NASDAQ Composite
- Dow Jones Industrial Average (DJIA)
The indexes listed above are not solely for the US market, they are for the whole global economy. If you wish to study the reports with regards to which direction these indices are going – you can tune into financial media outlets at various times a day, for example, CNBC, MarketWatch, Reuters and Bloomberg.
What are US Treasuries?
In order to raise money so that they can finance various projects or day to day operations, the US Treasury will issue bonds. US Government bonds are sometimes called T-Bills, releasing its bonds throughout the year.
With investments in mind, US Treasuries are considered to be a ‘safe-haven’ asset, because they are as close to risk-free as one might get. Below we have listed 3 different types of fixed-income securities that are used to fund these operations:
- Treasury notes: – aka T-note. Fixed-rate debt security maturity: 1-10 years.
- Treasury bonds: – aka T-bonds. Fixed-rate debt security maturity: 10-30 years).
- Treasury bills: – aka T-bills. Fixed-rate debt security maturity: 1 year and under.
Each and every fund operation pays out its interest in a contrasting way, and as you can see from our list above, each has a different maturity rate. This varies from a few months to three decades. Always look out for financial media reports on the different yields.
If yields are higher, it is highly probable that the market is selling off government debt, their yield improves the more the market falls. You can be sure that selling this risk-free asset heavily indicates that they are feeling confident about the wider economic scenario, which means the risk sentiment shifts to ‘risk-on’, from ‘risk-off’ as their yield has improved.
In a case of yields being down, the risk will shift to ‘risk-off’, a sign of apprehension due to purchasing the government debt as an alternative. As a result of this, the yield will be decreased due to the prices rising.
The Volatility Index
In this segment of the price action trading PDF we are going to have a quick run through the volatility index. Commonly referred to as VIX, this index looks at the likelihood of a specific market making an abrupt or unexpected shift in price, as well as market uncertainty.
In terms of having a good understanding of the amount of risk, ‘on’ or ‘off’, you can use VIX to hazard a guess at how much anxiousness the stock traders are feeling. Some people refer to VIX as the ‘fear gauge’ or ‘fear index’ for this very reason, and it remains one of the most widely used indexes of volatility across the board.
The S&P 500, for example, can be used to measure the market probabilities of volatility going forward. For instance:
- If VIX is giving a value of over 30, this will be seen as volatile
- If this is 20 or under, it is seen as being calm.
The higher that VIX is, the more the market will panic, so of course, this means that the lower the VIX is, the calmer the market will be.
Fiat Currencies
We can’t put together a price action trading PDF and neglect to mention currencies! After all, they are one of the most rapidly moving and fluid financial instruments globally.
What are Safe Haven Currencies?
As we briefly alluded to earlier, safe haven currencies are very sensitive to any risk sentiment changes, so they react very quickly. This means that they are either expecting the currency to maintain its initial value, or to increase in value in the ‘risk-off’ landscape.
The forex market is open 24 hours a day, 7 days a week, so as opposed to the US stock trading market, with forex you can always keep track of the risk sentiment whenever you need to check.
See below for some commonly used ‘safe haven’ currencies.
USD (US Dollar)
In light of how strong the USD is, this is a perfect representation of a ‘risk-off’ sentiment. The market would probably be very disappointed if the financial media and economic data was to report that the USD held more strength than other high yielding currencies.
In most cases this will normally lead to the markets looking to the US dollar as a ‘safe haven’. Interestingly, when a collection of investors do this at the same time, this leads to the value of the USD rising. If you are considering purchasing US treasuries (as a ‘safe haven’), then please note that if you haven’t already done so, you will have to purchase some USD in order to make that purchase.
CHF (Swiss Franc)
Switzerland has remained strong throughout many a financial crisis over the years, and the Swiss Franc (aka CHF) still carries a lot of strength as a currency. If the financial media reports that the strong yielding currencies are weaker than the CHF – this can be a strong indication that there has been some kind of market turmoil in Europe. In this case, the action shows a ‘risk-off’ environment.

JPY (Japanese Yen)
If the financial media is reporting that stronger yielding currencies are weaker than the Japanese Yen, the news/data will come as a disappointment to the markets. Particularly if the news is in relation to the US dollar, the markets are likely to look to JPY as a ‘safe haven’.
Some of the most popular currency pairs to pay special interest to are:
When it comes to ‘risk-on’ strategy trades, the above-listed currency pairs are very popular – and it can be a signal of ‘risk-aversion’ if there is a swift drop.
With a large amount of uncertainty the world is facing at this time; if for instance the AUD/JPY and USD/JPY are rising, the market might run for safety, maybe to EUR, JPY or CHF, because this is an indication that there has been a shift to ‘risk-on’ mode.
Can I buy 100% Risk-Free Assets?
Unfortunately no, you cannot. Like the loch ness monster and bigfoot, 100% risk-free assets just do not exist. The chances of being entirely risk-free are just impossible, as there are no guarantees that any asset will be entirely safe on a permanent basis.
In the instance of real money (aka cold hard fiat cash), there is still the risk of inflation slowly deteriorating your purchasing power. Historical highlights that this has happened many a time. ‘Risk on’ and ‘risk-off’ are illustrations of the market’s disposition, so the risk is always going to be in existence no matter what.
What’s Technical Analysis?
Using a price chart to predict the support, resilience and progression of price actions – technical analysis studies the price actions of the past, in order to try and predict what might happen in the future. By analysing price charts to predict momentum and resistance, technical analysis assists traders in predicting which trades have a higher probability. Therefore, this makes it easier to exit and enter those trades based on that probability.
Although technical analysis doesn’t attempt to measure an underlying set value, it does spot patterns by way of price charts and technical indicators, and so this creates a superb basis for entering and exiting trades. Emerging trends and price movements will follow an established pattern, and this is partly thanks to market psychology. Generally speaking, market members tend to act in a corresponding way when dealing with a corresponding situation.
It is commonly believed that the price patterns of the past do eventually repeat themselves later on. When deciding whether to enter movement information, it is considered very helpful amongst forex traders. The main objective of technical analysis is to study the information already available about the price of an asset, instead of focusing on the price movement’s statistical analysis.
The price trend will always be dictated by the analysis of the supply and demand in the market.
Here is the leading hypothesis of technical analysis:
- You have a better understanding of what market participants may do next.
- Traders are able to look at whether or not buying interest and selling interest is increasing/decreasing.
- Thanks to recent price changes you have observed, you can gain a much better understanding of where the buyer and sellers head spaces might be at.
These are the three main fundamentals technical analysis is based on:
- Due to buyers and sellers in the market, interest rates, and employment reports will be included within the price as a matter of course. The market really does mark everything down, even the macroeconomic conditions (aka fundamentals) are included in the currency pair cost.
- It is commonly believed that the pricing trends of the past will eventually come back around, so it is helpful to look to the past as well as the present trends.
- Trend and price move availability at your fingertips.
Why is Technical Analysis Useful?
The main objectives of technical analysis are:
- To monitor statistics and with the aim of making a consistent profit from trading, as well as to monitor any patterns appearing in the market.
- Abandon emotional contemplation, and enable you to make wise and educated trading decisions.
- Technical analysis helps you to understand when entering and exiting the market is a good idea. It’s all about timing, and when the market starts to change, technical analysis will know.
Technical analysis uses price charts and/or time-frames to enable it to spot a trend, backed up by the resilience of the market. When it comes to the market direction itself, there are just three options at this point, and they are as follows:
- Move up
- Move down
- Move sideways
In reality, prices will generally move in a zig-zag pattern, so the price action will only have two positions.
- Range: Prices will create a zig-zag shape, side to side.
- Trend: Prices will zig-zag much higher on an ‘uptrend’ and lower on a ‘downtrend’
The 3 main tools used by technical analysis are:
- Chart patterns: By means of identifying big chart patterns, they are able to forecast where prices might be heading towards.
- Price action: Achieved by analysing historical price movements, price action involves drawing up charts to predict which way the market is going, and of course – in what direction.
- Technical indicators: By using statistical tools and techniques you have access to selling and buying signals.
All in all, technical analysis is a vital tool, enabling you to choose the trades at the best odds and spot any feasible probability. Without utilising risk management remaining profitable is virtually unobtainable.
Chart Patterns – Explained
The basic principle of technical analysis is the use of chart patterns. The price movement will be illustrated using a variety of lines and/or curves (the chart pattern), and these patterns are key to the success of technical analysis.
- Wedges
- Triple bottoms
- Triple tops
- Pennants
- Head and shoulder formations
- Flags
Identifying and familiarizing yourself with these patterns can really enhance your chances of predicting which direction a price could go in. Chart pattern times can vary greatly and can be based on seconds, minutes, hours, or even months. This pattern depends on the number of people in the market paying attention to them.
A commonly used continuation chart pattern tends to use triangles, flags and pennants – The pattern assists traders in continuing a trend. Reversal chart patterns try to discover opportunities to trade on the reversal of a particular price trend.
As well as showing important information such as market sentiment and fair value, it also examines each asset class. Some of the asset classes a chart pattern examines are currencies, stocks and cryptocurrencies to name a few.
So now that we have covered the fundamentals, in the next section of our price action trading PDF we are going at the importance of psychology when trading.
The Psychology Behind Chart Patterns
Chart patterns heavily rely on market psychology. Supply and demand also play a major role when it comes to how chart pattern formations are created. Pressures when it comes to buying and selling help to create the chart patterns, so in theory, it is irrelevant which time frame you end up trading on because essentially humans put any orders forward.
The below list provides a simple explanation of time frames available when trading with chart patterns:
- A monthly or weekly time frame is great for position trading.
- 4-hour charts and day to day charts are good for swing trading
- 5 to 15-minute charts (known as intraday charts) are useful for day trading.
- Look out for the superior trend within your chosen time frame
- Once you have identified the dominant trend, you should be able to time the market by means of studying the chart pattern.
Unless you have an established framework, it’s not a good idea to trade entirely based on price patterns observed, as this is the equivalent of trading based on your emotions, which can be a weakness in trading.
Price Action Trading – The Very Best Brokers & Platforms
Having nearly made it to the end of our price action trading PDF, you should now have a good understanding of what price action trading is all about. Price action trading is a strategy used by experienced traders as a long-term, as well as a short-term, approach to trading.
Now we are going to give you a little information on 5 reputable brokers which are worth your time. Each one has been carefully selected by our team due to low fees and lots of asset classes to choose from. Most importantly, each broker is heavily regulated, so your money is safe at all times.
1. AVATrade – 20% Welcome Bonus
As soon as you feel ready to open a real cash account and start trading within the lives market, it’s worth mentioning that AVATrade provides very low spreads, and doesn’t expect a trading commission.
The welcome package on this platform is impressive with 20% offered up to $10,000.
- 20% welcome bonus of up to $10,000
- Minimum deposit $100
- Verify your account before the bonus is credited
2. VantageFX – Ultra-Low Spreads
VantageFX VFSC under Section 4 of the Financial Dealers Licensing Act that offers heaps of financial instruments. All in the form of CFDs - this covers shares, indices, and commodities.
Open and trade on a Vantage RAW ECN account to get some of the lowest spreads in the business. Trade on institutional-grade liquidity that is obtained directly from some of the top institutions in the world without any markup being added at our end. No longer the exclusive province of hedge funds, everyone now has access to this liquidity and tight spreads for as little as $0.
Some of the lowest spreads in the market may be found if you decide to open and trade on a Vantage RAW ECN account. Trade using institutional-grade liquidity that is sourced directly from some of the top institutions in the world with zero markup added. This level of liquidity and availability of thin spreads down to zero are no longer the exclusive purview of hedge funds.
- The Lowest Trading Costs
- Minimum deposit $50
- Leverage up to 500:1
To Conclude
Price action trading demonstrates a back to basics approach on trading. In simple terms, it’s never a good idea to solely focus on only price patterns of the past, or purely concentrating on the present either.
Hopefully, by the end of our price action trading PDF, you will have a much better understanding of exactly what price action trading is, and why having a firm grasp of its importance is going to be helpful for you when it comes to having a successful future in trading.
Eightcap - Regulated Platform With Tight Spreads

- Minimum deposit of just 250 USD to get lifetime access to all the VIP channels
- Use our Secure and Encrypted Infrastructure
- Spreads from 0.0 pips on Raw Accounts
- Trade on the Award-Winning MT4 & MT5 Platforms
- Multi-jurisdictional Regulation
- No Commission Trading on Standard Accounts

FAQ
What assets does price action trading work on?
How can I test my price action trading strategy out?
Is price action trading suitable for the short or long term?
Is price action trading the same as technical analysis?
What is risk sentiment in price action trading?
What safe havens does price action trading look for?
Does price action trading work?