STELLAR Price Analysis – October 20
Stellar price may reach the $0.42 resistance level and may break it up to test the resistance level of $0.48 and $0.55 level. In case the resistance level of $0.42 holds, price may face the support levels at $0.35, $0.30 and $0.24.
XLM/USD Market
Key Levels:
Resistance levels: $0.42, $0.48, $0.55
Support levels: $0.35, $0.30, $0.24
XLM/USD Long-term Trend: Bullish
Stellar is bullish on the daily chart. Stellar follow the last week predicted direction. It was reported that it is warming up for a bullish ride as it was consolidating around the resistance level of $0.35. The just mentioned level has been broken up by the bulls last week. The coin is rallying towards the resistance level of $0.42 at the moment.
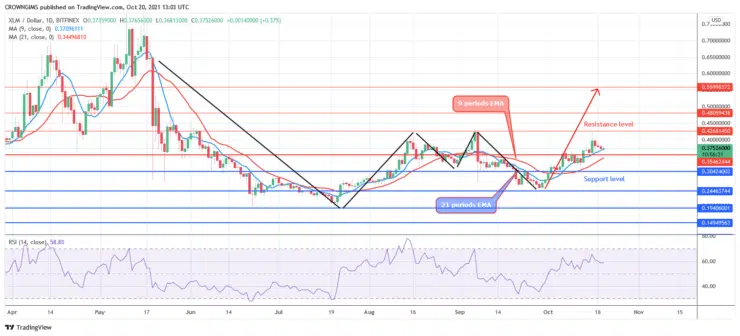
The dynamic resistance levels have been penetrated upside by Stellar. The price is trading above the 9 periods EMA and 21 periods EMA. Stellar price may reach the $0.42 resistance level and may break it up to test the resistance level of $0.48 and $0.55 level. In case the resistance level of $0.42 holds, price may face the support levels at $0.35, $0.30 and $0.24. The relative strength index period 14 is at 60 level bending up to indicate buy signal.
XLM/USD Medium-term Trend: Bullish
Stellar is on the bullish movement in the 4-hour chart. Bulls increased their pressure last week and break up the former resistance level of $0.35, the price increase and test the resistance level of $0.42. It pulled back to retest the support level of $0.35 level. Further price increase envisaged in the XLM market.
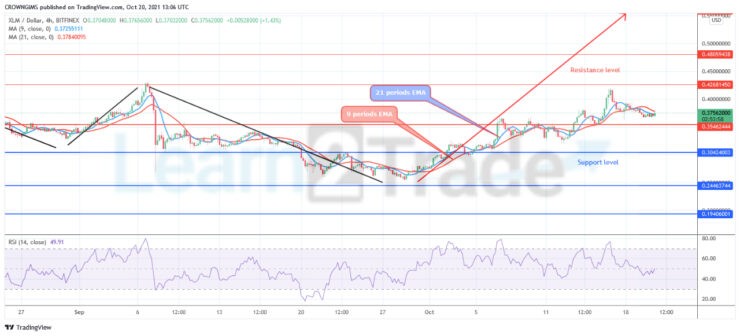
Stellar is trading below the 9 periods EMA and 21 periods EMA and the Relative Strength Index periods 14 is at 50 levels with the signal line pointing up to indicate a buy signal.
You can purchase crypto coins here. Buy Tokens
- Broker
- Min Deposit
- Score
- Visit Broker

- Award-winning Cryptocurrency trading platform
- $100 minimum deposit,
- FCA & Cysec regulated

- 20% welcome bonus of upto $10,000
- Minimum deposit $100
- Verify your account before the bonus is credited
- Fund Moneta Markets account with a minimum of $250
- Opt in using the form to claim your 50% deposit bonus
Learn to Trade
Never Miss A Trade Again

Signal Notification
Real-time signal notifications whenever a signal is opened, closes or Updated

Get Alerts
Immediate alerts to your email and mobile phone.

Entry Price Levels
Entry price level for every signal Just choose one of our Top Brokers in the list above to get all this free.