Don’t invest unless you’re prepared to lose all the money you invest. This is a high-risk investment and you are unlikely to be protected if something goes wrong. Take 2 minutes to learn more
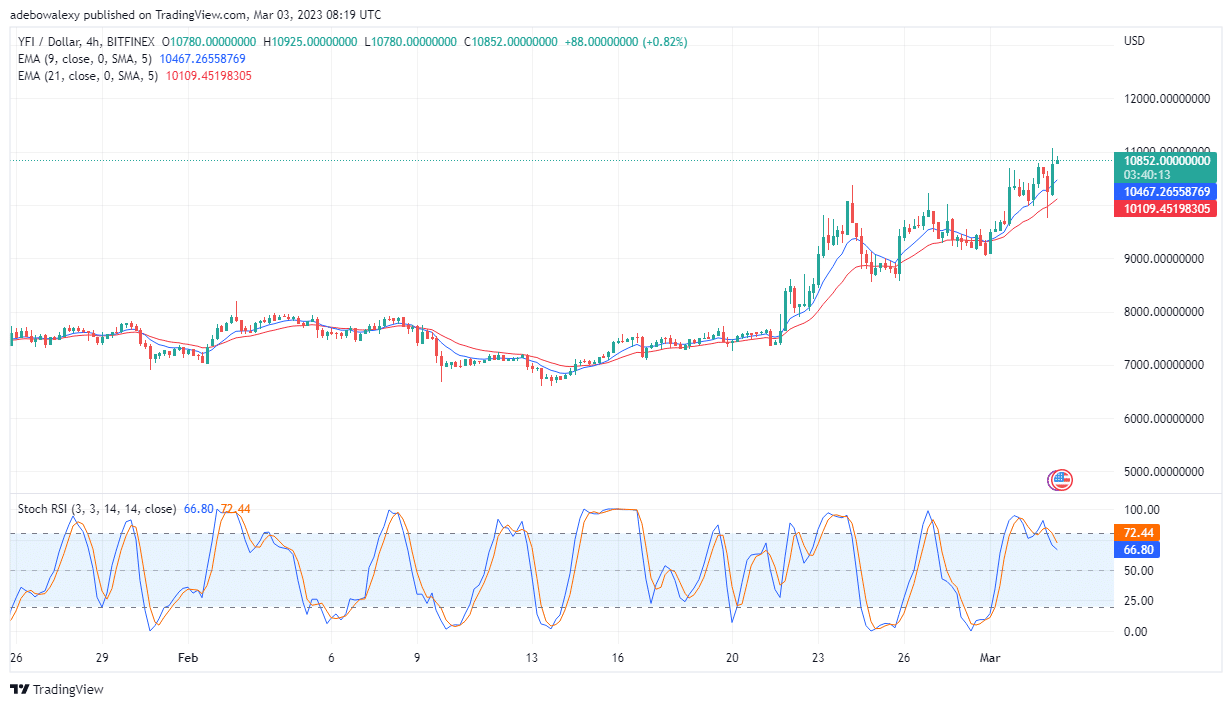
Since price action in the YFI/USD market broke up the price resistance level at $10,500, market bulls have advanced prices beyond that level. At this point, Yearn.finance is now eyeing the $11,000 resistance level. Without further ado, let’s zoom in for more insight.
Yearn finance Analysis Data:
Yearn.finance value now: $10,852
YFI market cap: $394,990,219
YFI moving supply: 36,637.72
Yearn.finance Supply: 36,666
YFI Coinmarketcap ranking: #98
Major Price Levels:
Top: $10,852, $10920, and $11,000
Base: $10,802, $10,752, and $10,700

Yearn.finance (YFI) Price Continues to Gather Profit Above the $10,500 Price Mark
The last price candle on the YFI/USD daily market appears to have found support above the Fibonacci level of 23.60. Subsequently, price action in this market is now closer to the $11,000 price resistance level. Additionally, it could be observed that price activity continues to occur above the 9- and 21-day EMAs. This perceived behavior of price action, suggests that this crypto is poised for more upside retracement. Likewise, the Stochastic RSI lines are still rising towards the 80 mark of the indicator. Consequently, as far as trading indicators are concerned, this market may gather more upside traction.
Yearn.finance (YFI) Seems to be Preparing to Catch More Tailwind
Another bullish price candle has just appeared on the 4-hour YFI/USD market, indicating that buyers have started this session on a good note. Consequently, this brightens the hopes of more upside price moves. Also, price actions stay above the 9- and 21-day EMA lines. However, the Stochastic RSI lines could be seen running down toward level 50 of the indicator. Nevertheless, a keen observer will reveal that the leading RSI line is slightly bent towards the slower one. By implication, this signals that the ongoing price trend is gaining strength and that a crossover may soon occur on the RSI. Subsequently, this may deliver more upside momentum to this market, and the price may eventually surpass the $11,000 mark.
- Broker
- Min Deposit
- Score
- Visit Broker

- Award-winning Cryptocurrency trading platform
- $100 minimum deposit,
- FCA & Cysec regulated

- 20% welcome bonus of upto $10,000
- Minimum deposit $100
- Verify your account before the bonus is credited
- Fund Moneta Markets account with a minimum of $250
- Opt in using the form to claim your 50% deposit bonus
Learn to Trade
Never Miss A Trade Again

Signal Notification
Real-time signal notifications whenever a signal is opened, closes or Updated

Get Alerts
Immediate alerts to your email and mobile phone.

Entry Price Levels
Entry price level for every signal Just choose one of our Top Brokers in the list above to get all this free.