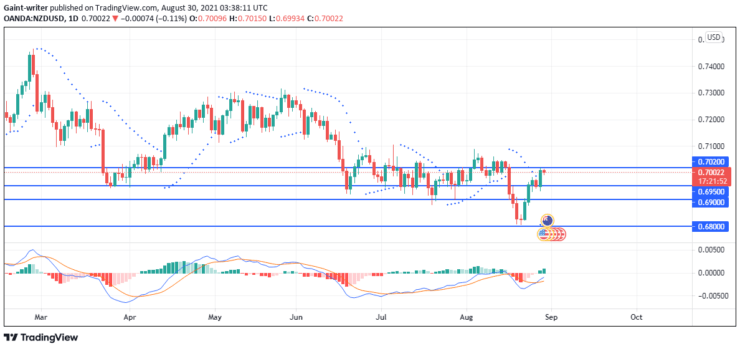
NZDUSD bears are making a significant pullback as the market is rallying upward. Before breaking out, the price initially broke through the 0.70200 resistance key level. However, the market entered a bearish trend after breaking through the major key levels of 0.69500 and 0.69000. Following that, the price reversed at the 0.68000 support key level, implying a bullish market.
NZDUSD Significant Zones
Resistance Level: 0.70200, 0.69500 Support Level: 0.69000, 0.68000
NZDUSD Long Term Trend: Bullish
The market then continued to rise, breaking past old resistance levels before retesting the 0.69500 key level. NZDUSD then continued to rise towards 0.70200. Price will either break through this level before retesting, or a pullback will occur around this level. This suggests that the market will have a short-term downtrend before the bullish momentum resumes. On the daily chart, the Parabolic SAR (Stop and Reverse) displays downward trend dots. This demonstrates that the market’s general tendency is bearish, despite prices rising upward.
However, the MACD (Moving Average Convergence and Divergence) indicator shows an increase in the green histogram. This indicates that the bullish market is still in command. Below the zero level, there appear to be crossovers between the signal lines and the moving average. This also accurately describes a bullish market scenario.
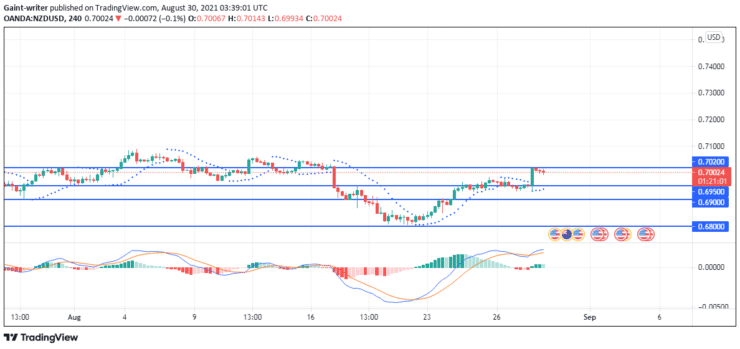
NZDUSD Short Term Trend: Bullish
On the 4-hour chart, the price retested the 0.69500 key level many times. As a result of this accumulation, the market then went higher towards the 0.7200 level. However, there are price responses around this level. NZDUSD may either break out and then fall back, or it may plummet and then pull back.
The parabolic SAR displays dots below the most recent higher low. As the market rallies upward, this indicates bullish momentum. On the MACD histogram, the green formation continues to grow. This also provides a clear explanation of the bullish market.
Note:Learn2.trade is not a financial advisor. Do your research before investing your funds in any financial asset or presented product or event. We are not responsible for your investing results.
Trade on MT4 with Leverage up to 1:500! Trade on MT4 with Leverage up to 1:500!
X
We use cookies to ensure that we give you the best experience on our website. If you continue to use this site we will assume that you are happy with it.OkPrivacy policy