Key Highlights
BCH targets the high of $804
BCH/USD faces strong rejection at level $700
Bitcoin Cash (BCH) Current Statistics
The current price: $648.50
Market Capitalization: $13,457,887,724
Trading Volume: $2,976,721,816
Major supply zones: $700, $720, $740
Major demand zones: $250, $230, $210
Bitcoin Cash (BCH) Price Analysis August 30, 2021
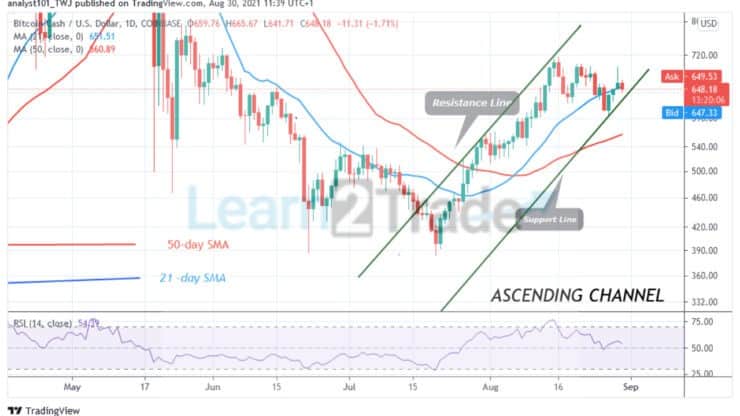
Bitcoin Cash (BCH) has fallen to $648.67 low. Since August 16, BCH has been in a downward correction after the uptrend was stalled at level $715. Buyers have retested the resistance zones thrice but could not break above the recent high. Yesterday, BCH was repelled as the altcoin dropped to $641 low. BCH will rally above $800 if buyers overcome the $715 resistance. Today, BCH has fallen to the support above 21-day SMA. The market will resume upward if the support holds.
Bitcoin Cash Technical Indicators Reading
The altcoin is at level 54 of the Relative Strength Index period 14. It indicates that the crypto is in the bullish trend zone and above the centerline 50. BCH is above the 21-day SMA. A break below the 21-day SMA will cause the altcoin to resume a downward move. The 21-day and 50-day SMAs are pointing northward indicating the uptrend.
Conclusion
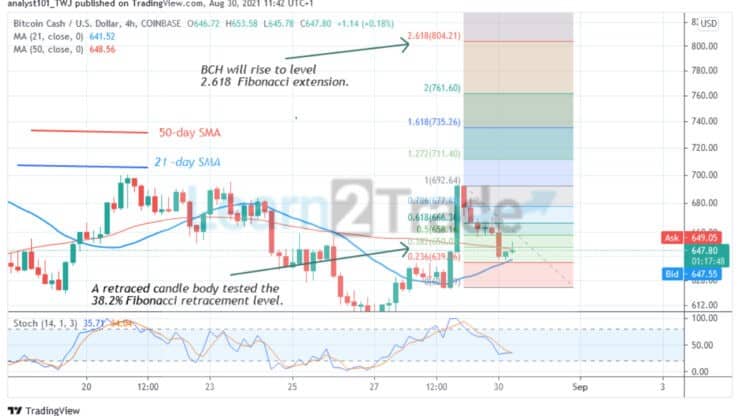
Following the recent breakdown, BCH is likely to resume an upward move. Meanwhile, on the August 29 uptrend, a retraced candle body tested the 38.2% Fibonacci retracement level. The retracement indicates that BCH will rise to level 2.618 Fibonacci extensions or level $ 804.21.
You can purchase crypto coins here: Buy Tokens
Note: Learn2.Trade is not a financial advisor. Do your research before investing your funds in any financial asset or presented product or event. We are not responsible for your investing results
- Broker
- Min Deposit
- Score
- Visit Broker

- Award-winning Cryptocurrency trading platform
- $100 minimum deposit,
- FCA & Cysec regulated

- 20% welcome bonus of upto $10,000
- Minimum deposit $100
- Verify your account before the bonus is credited
- Fund Moneta Markets account with a minimum of $250
- Opt in using the form to claim your 50% deposit bonus
Learn to Trade
Never Miss A Trade Again

Signal Notification
Real-time signal notifications whenever a signal is opened, closes or Updated

Get Alerts
Immediate alerts to your email and mobile phone.

Entry Price Levels
Entry price level for every signal Just choose one of our Top Brokers in the list above to get all this free.