Monero (XMR) Price Analysis: April 24
When bears increase their momentum it will break down the support level of $250, then, there may be a decrease towards the support level of $218 and $185. When the bulls increase their momentum, the resistance level of $293 may be penetrated upside, which may increase the price to previous high of $324 and $354
Key Levels:
Resistance Levels: $293, $324, $354
Support Levels: $250, $218, $185
XMRUSD Long-term Trend: Bullish
On the daily chart Monero is bullish. The coin is still obeying the command of the double bottom chart pattern formed on the daily time frame at $142 support level. The crypto increases and broke up the former resistance levels of $185 and $215. More pressure from the bulls pushed the price to test the high of $293 which is the October high. Last week, the mentioned level holds and the price is pulling back to retest $250 level.
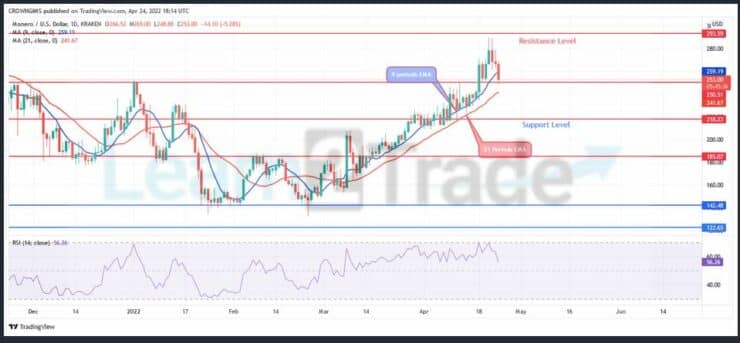
Monero price is trading between the 9 periods EMA and 21 periods EMA as a sign of bearish momentum. When bears increase their momentum it will break down the support level of $250, then, there may be a decrease towards the support level of $218 and $185. When the bulls increase their momentum, the resistance level of $293 may be penetrated upside, which may increase the price to previous high of $324 and $354. However, the relative strength index period 14 is at 56 levels with the signal line displaying bearish direction.
XMRUSD Price Medium-term Trend: Bearish
Monero is on the bearish movement on 4-Hour chart. The price reached the resistance level of $293 on April 21. The bulls could not break up the just mentioned level. It pulled back and began to form a double top chart pattern. At the moment, the price is trying to break down the resistance level of $249 level.
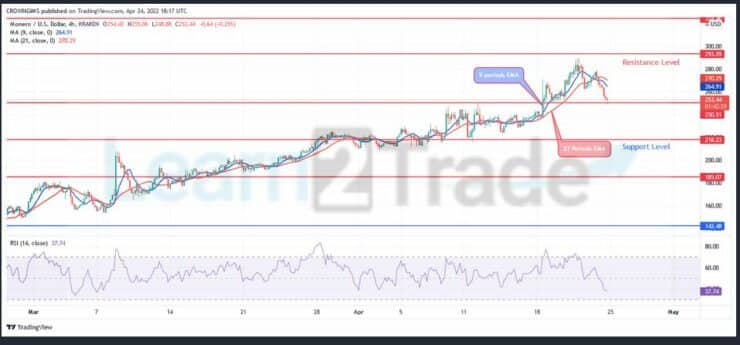
The price is trading below the two EMAs with the 9-day EMA crossing the 21-day EMA downside which indicate a bearish market. The relative strength index is at 42 levels pointing down to indicate sell signal.
You can purchase Lucky Block here: Buy LBlock
- Broker
- Min Deposit
- Score
- Visit Broker

- Award-winning Cryptocurrency trading platform
- $100 minimum deposit,
- FCA & Cysec regulated

- 20% welcome bonus of upto $10,000
- Minimum deposit $100
- Verify your account before the bonus is credited
- Fund Moneta Markets account with a minimum of $250
- Opt in using the form to claim your 50% deposit bonus
Learn to Trade
Never Miss A Trade Again

Signal Notification
Real-time signal notifications whenever a signal is opened, closes or Updated

Get Alerts
Immediate alerts to your email and mobile phone.

Entry Price Levels
Entry price level for every signal Just choose one of our Top Brokers in the list above to get all this free.