Bulls’ momentum is increasing in the USDCHF market
USDCHF Price Analysis – 02 June
The $0.91 barrier level may be broken if buyers apply enough pressure, and the rising trend may continue to the $0.92 and $0.93 levels. If sellers are successful in holding the $0.91 resistance level, the price may decline past the $0.90 support level and toward the $0.89 and $0.88 support levels.
USDCHF Market
Key Levels:
Resistance levels: $0.91, $0.92, $0.93
Support levels: $0.90, $0.89, $0.88
USDCHF Long-term trend: Bullish
On a long-term basis, USDCHF is moving upward. Buyers started dominating the USDCHF market a few weeks ago. The price breached the $0.89 support level. It traveled in all directions for a few days. In response to the formation of a bullish engulfing candle on May 11, the price rose to test the $0.90 resistance level. On May 19, the price retraced to $0.89 once more as buyers and sellers fought for control of the previous level. It has broken up the $0.90 level and exposed to $0.91 resistance level.
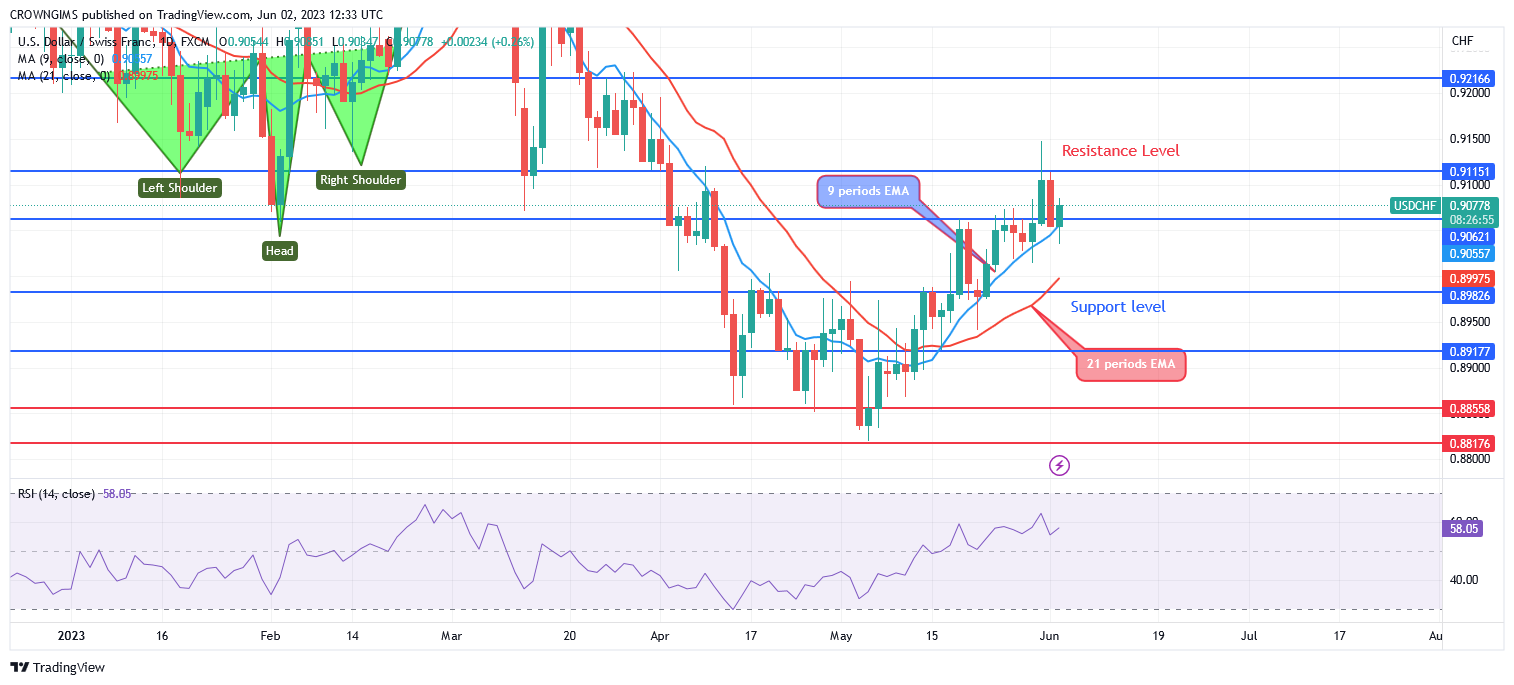
The 9-period EMA has crossed the 21-period EMAs higher, and the USD/CHF price is currently just above the two EMAs. A bullish market is indicated by the Relative Strength Index period 14 at 56 levels. The $0.91 barrier level may be broken if buyers apply enough pressure, and the rising trend may continue to the $0.92 and $0.93 levels. If sellers are successful in holding the $0.91 resistance level, the price may decline past the $0.90 support level and toward the $0.89 and $0.88 support levels.
USDCHF Medium-term Trend: Bullish
USDCHF is bullish in the medium-term outlook. The double bottom chart pattern formed at the $0.88 support level a few weeks ago. This represents a bullish market. A range of the currency pair’s trend during the previous two weeks was determined by the resistance level of $0.89 and the support level of $0.88. The price is inclining and approaching closer to the $0.91 resistance level as a result of the buyers’ efforts. The cost is still going up.
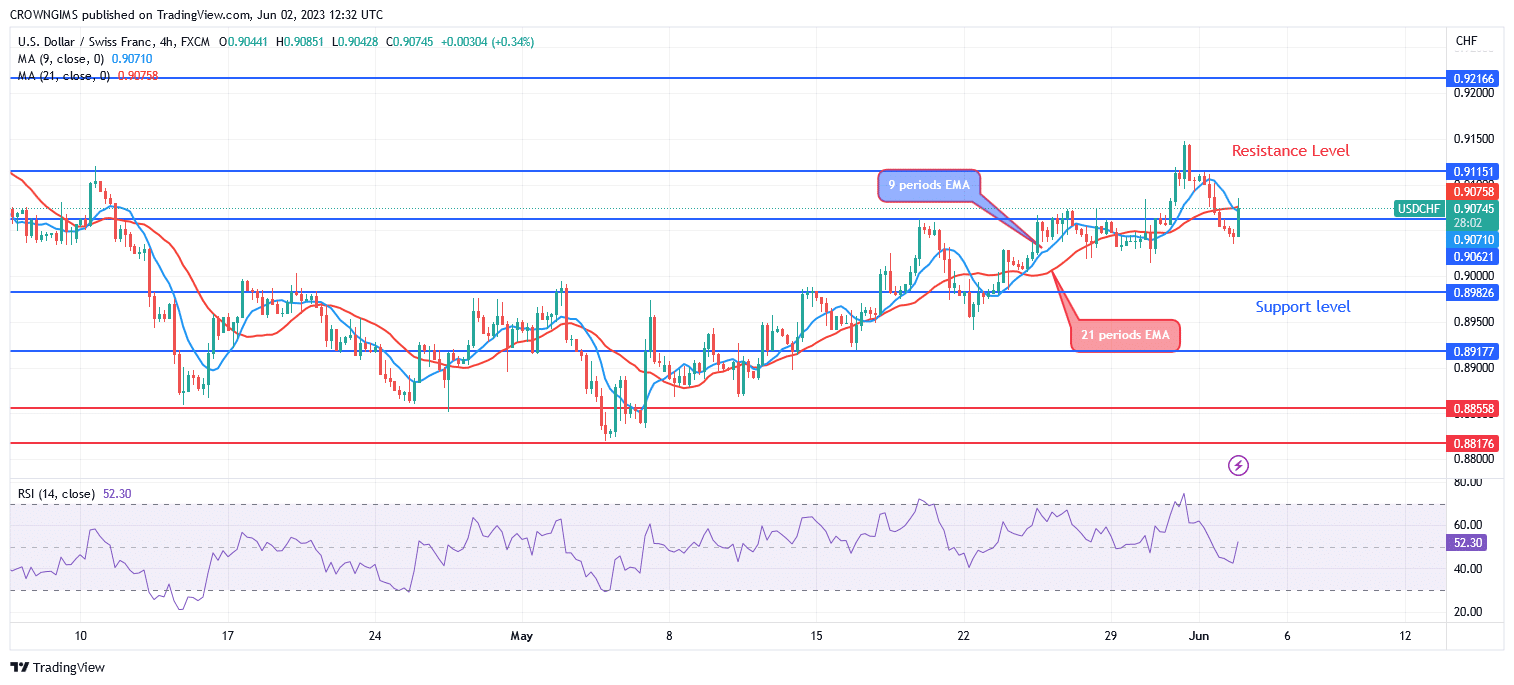
The 9-period EMA and the 21-period EMA have crossed upward. The USDCHF is currently trading above the two exponential moving averages, indicating a bullish market.
You can purchase Lucky Block here. Buy LBLOCK
- Broker
- Min Deposit
- Score
- Visit Broker

- Award-winning Cryptocurrency trading platform
- $100 minimum deposit,
- FCA & Cysec regulated

- 20% welcome bonus of upto $10,000
- Minimum deposit $100
- Verify your account before the bonus is credited
- Fund Moneta Markets account with a minimum of $250
- Opt in using the form to claim your 50% deposit bonus
Learn to Trade
Never Miss A Trade Again

Signal Notification
Real-time signal notifications whenever a signal is opened, closes or Updated

Get Alerts
Immediate alerts to your email and mobile phone.

Entry Price Levels
Entry price level for every signal Just choose one of our Top Brokers in the list above to get all this free.