Arbitrum Price Forecast: June 2
The Arbitrum price forecast is for the market to keep ranging for a while as the buyers get empowered for a breakout.
Arbitrum Long-Term Trend: Bullish (4-hour Chart)
Key Levels:
Zones of supply: $1.2880, $1.3310, $1.4360
Zones of Demand: $1.1910, $1.1550, $1.0620

The last month of the first half of the year shows signs for the Arbitrum market. Having used a large part of its cycle from the beginning of the year in tapering downward through a triangle structure. The price has used the $1.1100 support level to edge out of that structure, and the market is now bullish. The ranging cycle preceding its final surge.
Arbitrum Price Forecast: ARB/USD Outlook
Arbitrum has utilised the $1.1100 support zone to edge its market out of the triangle structure that has confined it for the past few months. The price has also risen above $1.1550.
From the $1.1550 support level, the price rose to test the $1.2880 resistance level. However, the resistance proved to be strong, causing the price to drop back to the support level. Afterwards, it rose again, resulting in a sideways movement.
The price is currently consolidating to gain enough strength to break through the resistance level. The Stochastic Oscillator line is trending upwards and is expected to enter the overbought territory following a pullback.
ARB/USD Medium-Term Trend: Bullish (1-hour chart)
The Relative Strength Index (RSI) line on the daily chart indicates that there is still a significant distance to be covered. Currently, the RSI line is responding near the middle line after previously being below it. However, on the 4-hour chart, the RSI line has made greater advancements and now sits above the midline.
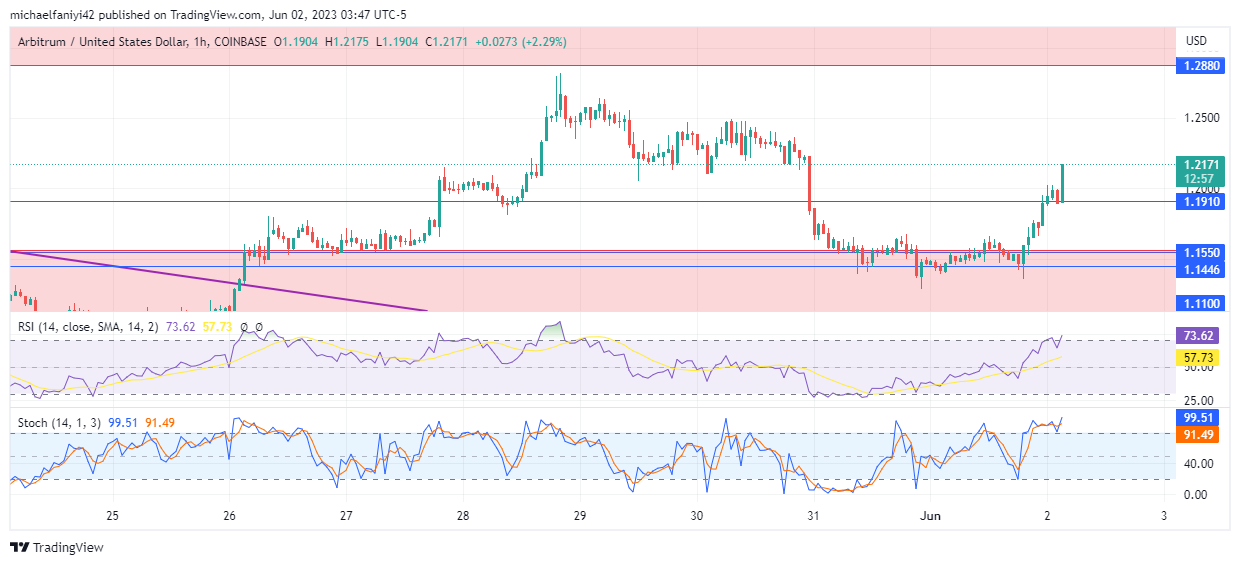
The lines of the Stochastic Oscillator indicate more progress in the short term. One line has surpassed the midline, and we anticipate that both lines will rise into the overbought region. The market will probably remain in a range for some time to weaken the resistance before further pushing higher.
How To Buy Lucky Block – Guide, Tips & Insights | Learn 2 Trade
Note: Learn2.trade is not a financial advisor. Do your research before investing your funds in any financial asset or presented product or event. We are not responsible for your investing results.
- Broker
- Min Deposit
- Score
- Visit Broker

- Award-winning Cryptocurrency trading platform
- $100 minimum deposit,
- FCA & Cysec regulated

- 20% welcome bonus of upto $10,000
- Minimum deposit $100
- Verify your account before the bonus is credited
- Fund Moneta Markets account with a minimum of $250
- Opt in using the form to claim your 50% deposit bonus
Learn to Trade
Never Miss A Trade Again

Signal Notification
Real-time signal notifications whenever a signal is opened, closes or Updated

Get Alerts
Immediate alerts to your email and mobile phone.

Entry Price Levels
Entry price level for every signal Just choose one of our Top Brokers in the list above to get all this free.