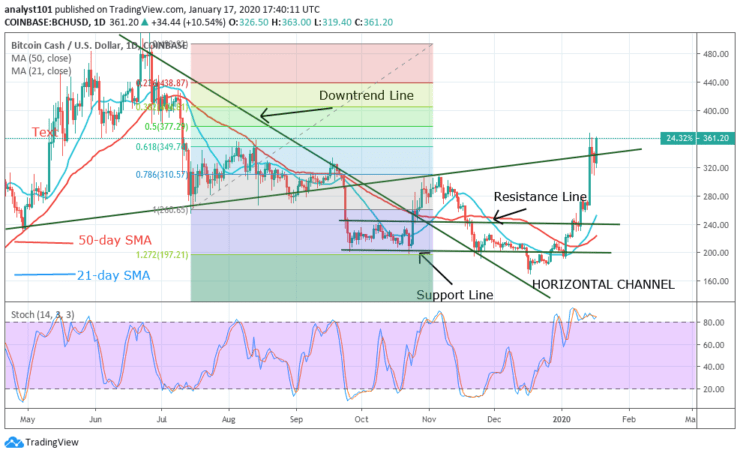
Key Support Levels: $200, $160, $120
BCH/USD Price Long-term Trend: Bullish
Bitcoin Cash has made a tremendous move to a higher price level. The bullish move is very significant because it took six days to break the lower and upper price range of $200 and $240. In retrospect, BCH was range-bound for four months before the resumption of another selling pressure. The last bearish move was at the low of $171 where the bulls took their initiative.
The upward move commenced from a low of $171 to a high of $360 on January 14. Below the resistance at $360, Bitcoin Cash is fluctuating in a tight range of $360 and $320. The coin can break either of the price levels and move on. BCH will rise and reach a high of $400 or $440 if the bulls break the current resistance. The coin may drop to the low of $280 or 240 if the $320 support cracks.
Daily Chart Indicators Reading:
Bitcoin Cash is trading in the overbought region of the daily stochastic. At the overbought region, there are presence of sellers who may push price downward. The coin is above 80% range which indicates that the coin is in a strong bullish momentum. The moving averages are showing signs of a bullish crossover.
BCH/USD Medium-term bias: Bullish
On the 4-Hour chart, the coin is making a series of higher highs and higher lows. The coin reaches a high of $360 and retraces to $320 and then resumes a sideways move. The price bars are clustering below the resistance zone. A breakdown or breakout is imminent.
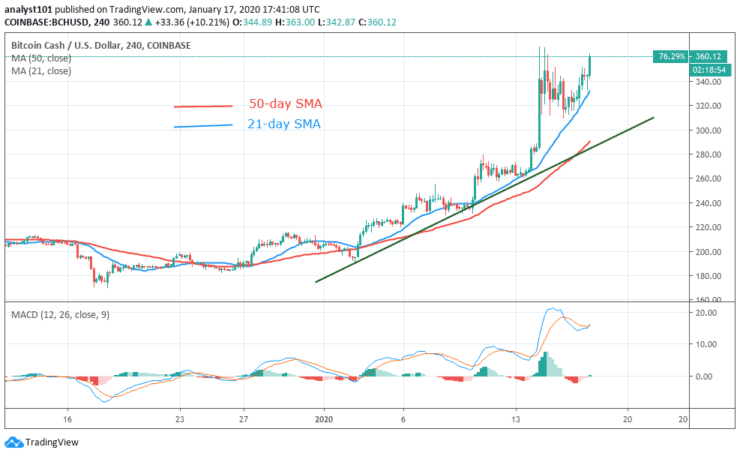
4-hour Chart Indicators Reading
The MACD line and the signal line are above the zero lines which indicates a buy signal. The 21-day SMA and the 50-day SMA are sloping upwards indicating the upward move.
General Outlook for Bitcoin Cash (BCH)
Bitcoin Cash is presumed to be out of the downtrend zone. The price bars are above the 21-day SMA and 50-day SMA indicating that the upward move is ongoing. The coin will remain bullish as long as it is is in the bullish trend zone. BCH is moving upward after testing the $320 support level.
Bitcoin Cash Trade Signal
Instrument: BCH/USD
Order: Buy
Entry price: $359
Stop: $300
Target: $440
Note: Learn2Trade.com is not a financial advisor. Do your research before investing your funds in any financial asset or presented product or event. We are not responsible for your investing results
- Broker
- Min Deposit
- Score
- Visit Broker

- Award-winning Cryptocurrency trading platform
- $100 minimum deposit,
- FCA & Cysec regulated

- 20% welcome bonus of upto $10,000
- Minimum deposit $100
- Verify your account before the bonus is credited
- Fund Moneta Markets account with a minimum of $250
- Opt in using the form to claim your 50% deposit bonus
Learn to Trade
Never Miss A Trade Again

Signal Notification
Real-time signal notifications whenever a signal is opened, closes or Updated

Get Alerts
Immediate alerts to your email and mobile phone.

Entry Price Levels
Entry price level for every signal Just choose one of our Top Brokers in the list above to get all this free.