Key Support Zones: $7, 000, $6, 000, $5,000
BTC/USD Long-term Trend: Bullish
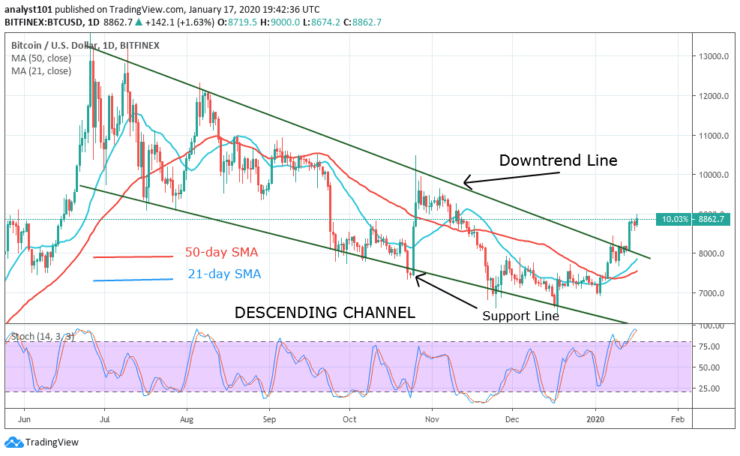
Bitcoin is still trading in the bullish trend zone. We have entered the fourth day as Bitcoin continues to struggle below the $8,800 resistance level. On a daily bases, the bulls will test the resistance level and pullback. As the coins fluctuate below the resistance level, the coin is characterized by indecisive candlesticks like the Dojis and the Spinning tops.
These candlesticks describes the indecision between the buyers and sellers. Nonetheless, if the bulls succeed in breaking the $8,800 resistance, the market will move to the $9,500. Meanwhile, the fluctuation is ongoing below the resistance level.
Daily Chart Indicators Reading:
Bitcoin is in a strong bullish momentum as the stochastic bands are above the 80% range. It is possible that sellers may show up in the overbought region of the market. The purpose is to push the price downward. The EMAs are also showing signs of a bullish crossover indicating price rise.
BTC/USD Medium-term bias: Bullish
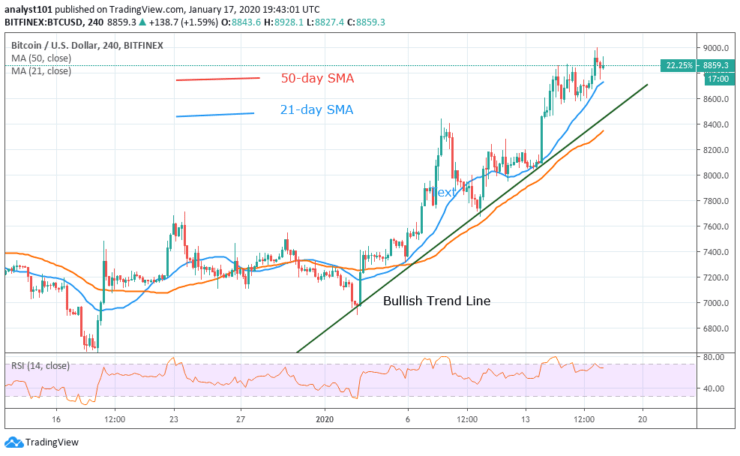
On the 4 hour chart, the price is in an uptrend. The coin is making a series of higher highs and higher lows. The uptrend is showing the support levels of price where traders can initiate long trades. The bulls are testing the resistance at $9,000, while the price pulls back.
4-hour Chart Indicators Reading
The RSI period 14 level 66 indicates that the market is above the centerline 50. It means that Bitcoin will rise. The 21-day SMA and the 50-day SMA are sloping upward indicating the upward move.
General Outlook for Bitcoin (BTC)
For the past four days, Bitcoin is in a sideways trend. The upward move has been hampered at the $8,800 resistance level. The market is actually fluctuating between the levels of $8,600 and $8,800. In a couple of days to come, we should expect a price breakout or price breakdown. A bullish breakout will see the Bitcoin reached a high of $9,500. All the indicators are showing buy signals
BTC Trade Signal
Instrument: BTC/USD
Order: Buy
Entry price: $8,800
Stop: $8,000
Target: $9,500
Note: Learn2Trade.com is not a financial advisor. Do your research before investing your funds in any financial asset or presented product or event. We are not responsible for your investing results
- Broker
- Min Deposit
- Score
- Visit Broker

- Award-winning Cryptocurrency trading platform
- $100 minimum deposit,
- FCA & Cysec regulated

- 20% welcome bonus of upto $10,000
- Minimum deposit $100
- Verify your account before the bonus is credited
- Fund Moneta Markets account with a minimum of $250
- Opt in using the form to claim your 50% deposit bonus
Learn to Trade
Never Miss A Trade Again

Signal Notification
Real-time signal notifications whenever a signal is opened, closes or Updated

Get Alerts
Immediate alerts to your email and mobile phone.

Entry Price Levels
Entry price level for every signal Just choose one of our Top Brokers in the list above to get all this free.