• The $6000 resistance is a key breakout level for Bitcoin to start a short-term increase
Bitcoin has remained in a consolidation mode for a while now after recovering from the $4000 (the current 2020 low) last week. Though Bitcoin is still under a bearish control the sentiment is technically weak at the moment. There’s a need for a break above the $6000 (the level that Bitcoin got rejected two days ago after the Fed rate cut news) before we start to consider bullish move on a short-term.
Key resistance levels: $6000, $6500
Key support levels: $5000, $4465
Bitcoin (BTC) Price Analysis: 4H Chart – Neutral
Since Bitcoin bounced back from $4000 (Bitfinex), the price has been facing resistance around $6000, which is now subjecting the market to a sideways trend. Yesterday, Bitcoin made daily low at $4465 but managed to climb back to where it’s currently trading at $5300 against the US Dollar.
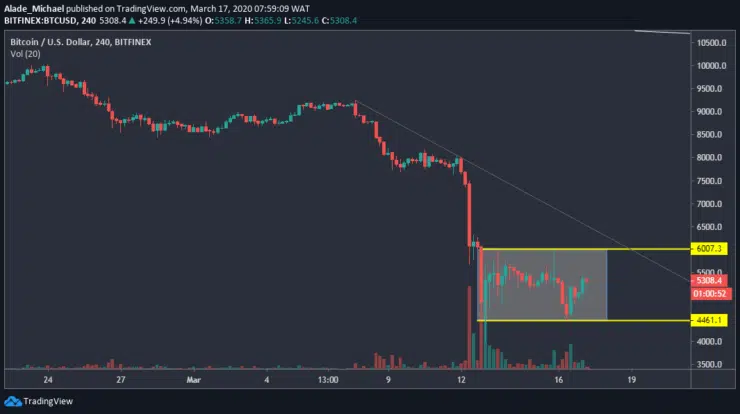
As we can see on the 4-hours chart, Bitcoin is charging towards the $6000 resistance again. If the price can test this resistance and overcome it, the next level of resistance would be $6500 and above. More so, buyers would need to push above the grey regression line for a clear uptrend. On the downside, $4465 remains temporal support for Bitcoin. A fresh decrease may start if the price drops beneath this support.
Bitcoin (BTC) Price Analysis: Hourly Chart – Neutral
The hourly chart for Bitcoin shows that the price is forming a bear flag pattern. As we can see, the price is reaching a tight area on the symmetrical triangle. We should expect Bitcoin to break out from this triangle in the next 48-hours. Meanwhile, the price could break to both sides.
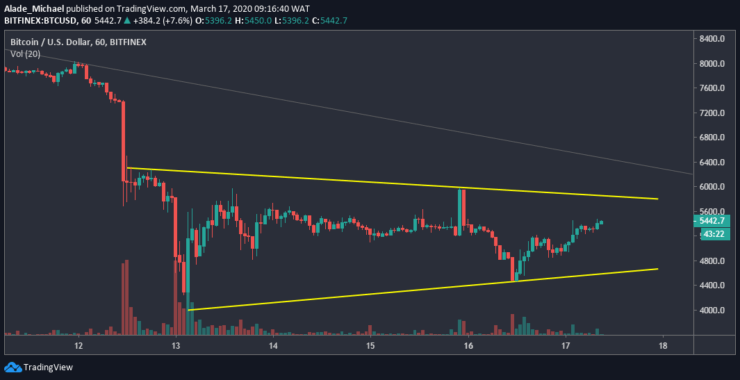
In case of a break-up, the first resistance level for Bitcoin is $6000 (weekly high), followed by $6300 (the support-turned-resistance on March 12). Above this resistance lies $6500. Inversely, Bitcoin holds fragile support at $4800. The next support here is $4465 (yesterday’s low), which is slightly below the triangle. In case of a significant break-down, the price could roll back to $4000 (last week’s low).
BITCOIN BUY ORDER
Buy: $5300
TP: $5700/ $5900
SL: $4800
- Broker
- Min Deposit
- Score
- Visit Broker

- Award-winning Cryptocurrency trading platform
- $100 minimum deposit,
- FCA & Cysec regulated

- 20% welcome bonus of upto $10,000
- Minimum deposit $100
- Verify your account before the bonus is credited
- Fund Moneta Markets account with a minimum of $250
- Opt in using the form to claim your 50% deposit bonus
Learn to Trade
Never Miss A Trade Again

Signal Notification
Real-time signal notifications whenever a signal is opened, closes or Updated

Get Alerts
Immediate alerts to your email and mobile phone.

Entry Price Levels
Entry price level for every signal Just choose one of our Top Brokers in the list above to get all this free.