Don’t invest unless you’re prepared to lose all the money you invest. This is a high-risk investment and you are unlikely to be protected if something goes wrong. Take 2 minutes to learn more
The Graph price action has moved only 2.42% up today. However, such minimal movement has placed this crypto in the second spot on the crypto daily movers list. The daily chart isn’t showing much optimism yet, but let’s further examine this market for better insight.
The Graph (GRT) Analysis Data:
GRT value now: $0.1476
GRT market cap: $1,293,789,443
The Graph moving supply: 8,786,937,678
GRT Total Supply: 10,583,780,797
The Graph Coinmarketcap ranking: #40
Major Price Levels:
Top: $0.1476, $0.1500, $0.1540
Base: $0.1450, $0.1430 $0.1400
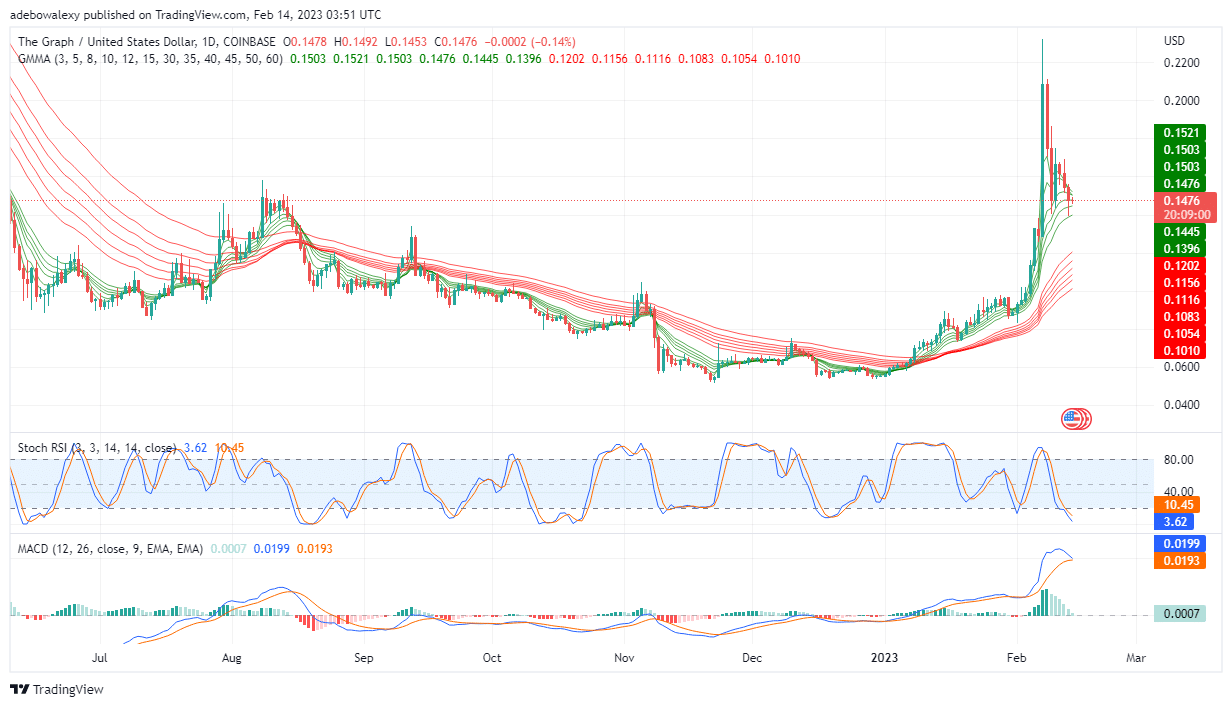
The Graph (GRT) Still Retains More Bearish Characteristics
Price action in the GRT/USD market has been moving downward since three trading sessions ago. The price candles can be seen crossing below some of the GMMA (Guppy Multiple Moving Average) curves. Meanwhile, the RSI lines continue to reach the oversold region. The MACD indicator curves are now touching at the tips, in an attempt to perform a bearish crossover. Nevertheless, one should consider the size of the last price candle here, as it appears to portray a pullback attempt. Perhaps, The Graph may develop upside strength from here.
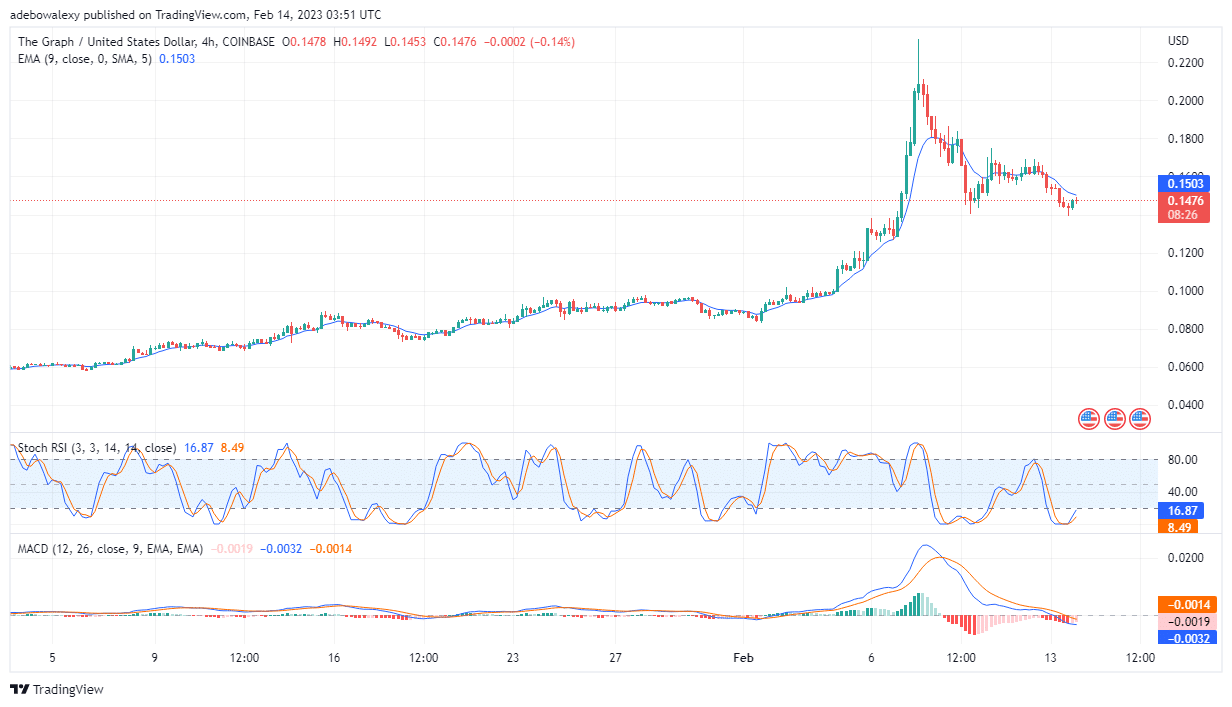
The Graph (GRT) Price Action Shows Some Positive Signs
Coming to the GRT/USD 4-hour market, The Graph price action looks more interesting. Here, price action has managed to record some gains in the past trading session. To this effect, trading indicators have started showing some positive signs. The RSI indicator lines are now projected upward, while the MACD indicator continues to reveal that sellers may be getting exhausted. This can be seen through the MACD bars, which appear slightly red below the 0.00 average. However, we should take note of the last price candle here, as it is a red doji. This price candle reveals that price action has managed to lose some momentum, though it is very minimal. Traders may choose to trust their technical indicators and hope that GRT price may rise toward $0.1550.
- Broker
- Min Deposit
- Score
- Visit Broker

- Award-winning Cryptocurrency trading platform
- $100 minimum deposit,
- FCA & Cysec regulated

- 20% welcome bonus of upto $10,000
- Minimum deposit $100
- Verify your account before the bonus is credited
- Fund Moneta Markets account with a minimum of $250
- Opt in using the form to claim your 50% deposit bonus
Learn to Trade
Never Miss A Trade Again

Signal Notification
Real-time signal notifications whenever a signal is opened, closes or Updated

Get Alerts
Immediate alerts to your email and mobile phone.

Entry Price Levels
Entry price level for every signal Just choose one of our Top Brokers in the list above to get all this free.