Litecoin (LTC) Price Analysis – October 10
Litecon’s price has managed to produce +10% gain over the last few days after relying on the $50, although the price movement has been recently sluggish. Despite the low volatility, LTC is currently correcting gain of +1.53%. It will be interesting to see a significant bullish break at $60 if traders can show a strong commitment to buying. Technically, that may seem difficult at the moment. Should breakout materialize, the 6th largest cryptocurrency could skyrocket.
Litecoin (LTC) Price Analysis: Daily Chart – Bearish
Key resistance levels: $62, $67, $70, $78
Key support levels: $54, $50, $47, $43
Following the last 15 days of price variations, Litecoin is considered bullish on the daily chart but its trend has remained in a downward range since June 22 bearish reversal. Now, the price of LTC is subdued in the descending wedge formation with a potential break – which is mostly to the upside for this pattern. A clear wedge’s break-up should produce a strong buy to $67, $70 and $78 after leaving $62 resistance.
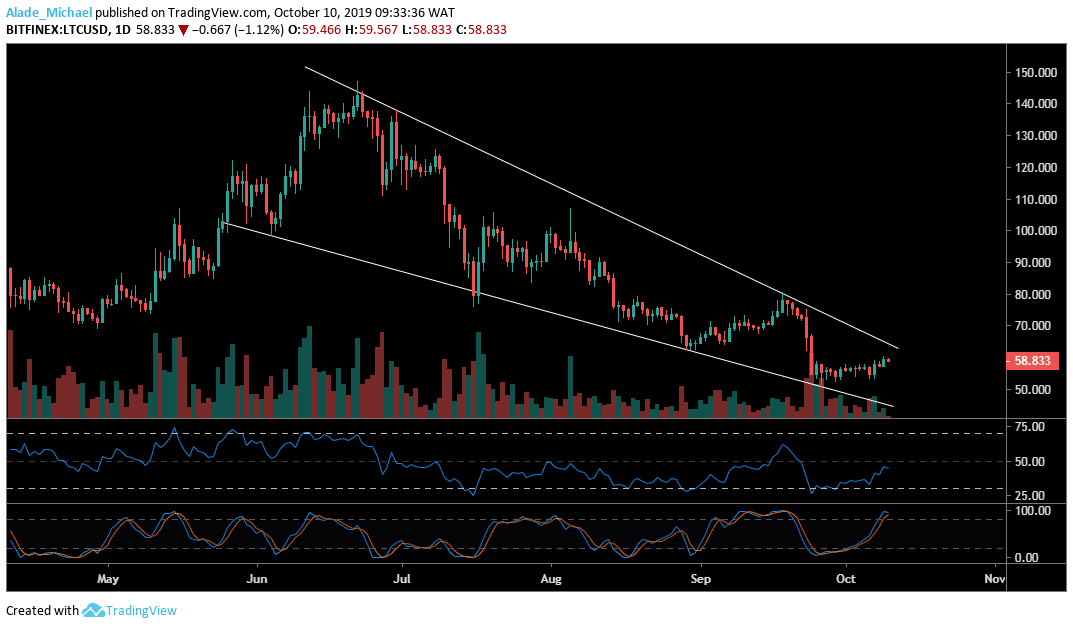
Litecoin may sell back to the September low at $54 and $50 if the price actions keep respecting the wedge formation. The $47 and $43 may further act as lower support. The crypto trading signals a bullish regroup near the RSI 50 – reflecting the past days of buying pressure. Stochastic RSI suggests a bullish momentum but has now reached an overvalued area, which means the sellers might be around the corner.
Litecoin (LTC) Price Analysis: Hourly Chart – Bullish
The LTC/USD pair looks bullish on the hourly time frame. Looking at the ascending wedge (green) that forms inside the channel pattern (white), a potential bearish play is at hand at the moment. A double-top formation is likely at $60 before rolling over to $57 and $55 support. Conversely, the RSI is currently testing the 50 level as the further low drive could make the market oversold.
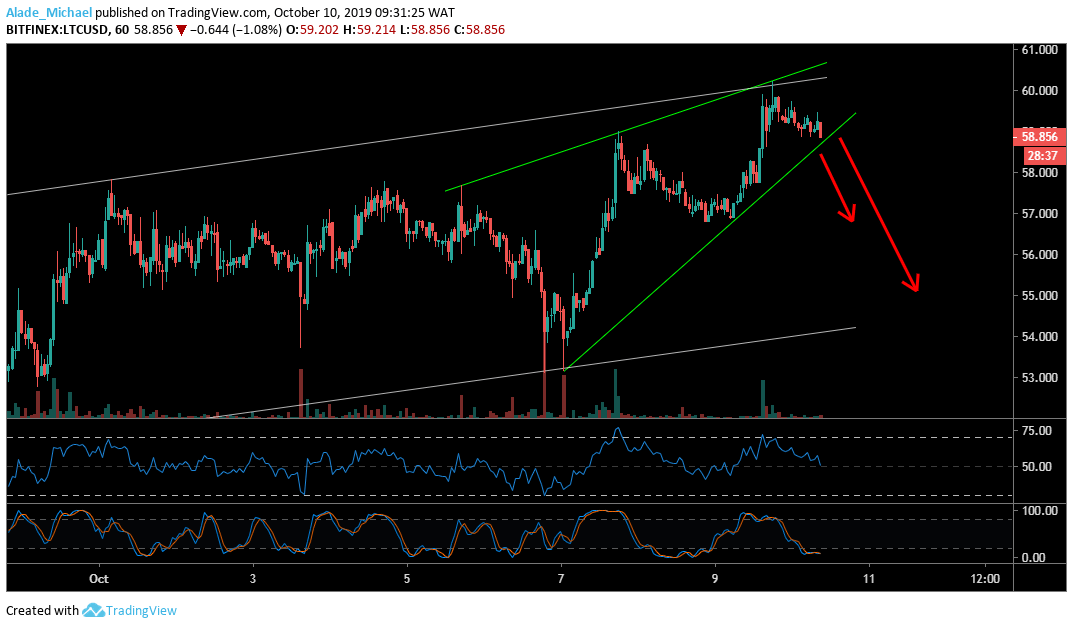
As we can see, the crypto trading signals that Litecoin is trading conveniently in the oversold area of the Stochastic RSI. In case of a bullish crossover, we can expect the market to keep rising at key resistance. However, $62 resistance may be tested if the buyers can continue to sustain pressure in the market. At the moment, the bulls are still showing strength inside the channel formation
LITECOIN SELL SIGNAL
Sell Entry: $59.5
TP: $55
SL: $61
- Broker
- Min Deposit
- Score
- Visit Broker

- Award-winning Cryptocurrency trading platform
- $100 minimum deposit,
- FCA & Cysec regulated

- 20% welcome bonus of upto $10,000
- Minimum deposit $100
- Verify your account before the bonus is credited
- Fund Moneta Markets account with a minimum of $250
- Opt in using the form to claim your 50% deposit bonus
Learn to Trade
Never Miss A Trade Again

Signal Notification
Real-time signal notifications whenever a signal is opened, closes or Updated

Get Alerts
Immediate alerts to your email and mobile phone.

Entry Price Levels
Entry price level for every signal Just choose one of our Top Brokers in the list above to get all this free.