Key Resistance Zones: 5800, 6000, 6200
Key Support Zones: 5000, 4800, 4600
France 40 (FR40EUR) Long-term Trends: Ranging
The index is currently in a sideways trend between levels 5250 and 4750. The market has continued its sideways move unabated. Recently, the price reached the support line but fail to break below it. The sideways move has resumed as price moves up.
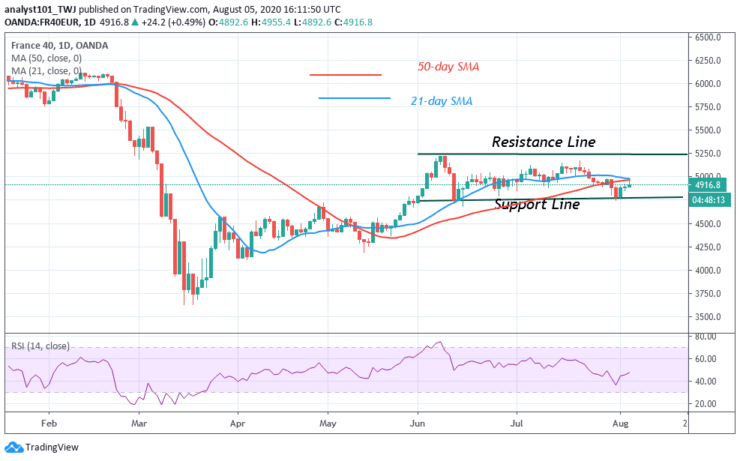
Daily Chart Indicators Reading:
France 40 index has fallen to level 48 of the Relative Strength Index. This implies that the market has reached the downtrend zone. The 21-day and 50-day SMAs are sloping horizontally. The index will resume uptrend or downtrend if price breaks the key levels of the market.
France 40 (FR40EUR) Medium-term Trend: Ranging
On the 4- hour chart, the market has continued the sideways trend. The market has a choppy price action. The price is fluctuating in the middle of price range. The key levels are rarely retested as the market continues consolidation.
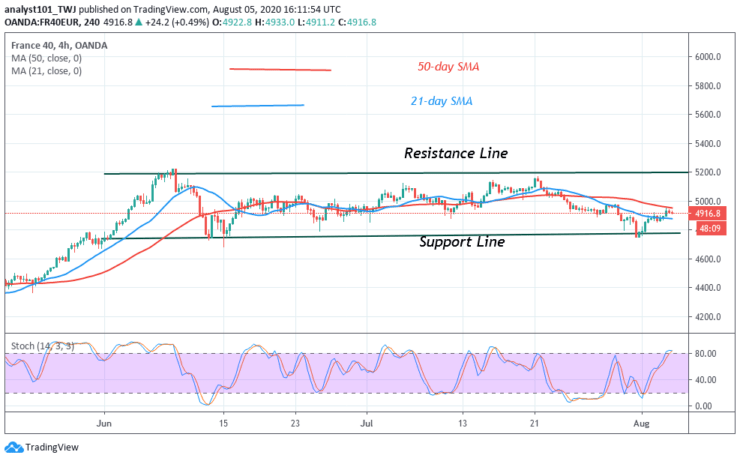
4-hour Chart Indicators Reading
The price is presently above 80% range of the daily stochastic. The index has reached the overbought region of the market. Prices may have a downward move. The SMAs are moving sideways indicating the sideways trend.
General Outlook for France 40 (FR40EUR)
France 40 is in a sideways trend. The market is in a choppy price action. The market is also characterized by small body candlesticks like spinning tops and Doji candlesticks.
Note:Learn2.Trade is not a financial advisor. Do your research before investing your funds in any financial asset or presented product or event. We are not responsible for your investing results
- Broker
- Min Deposit
- Score
- Visit Broker

- Award-winning Cryptocurrency trading platform
- $100 minimum deposit,
- FCA & Cysec regulated

- 20% welcome bonus of upto $10,000
- Minimum deposit $100
- Verify your account before the bonus is credited
- Fund Moneta Markets account with a minimum of $250
- Opt in using the form to claim your 50% deposit bonus
Learn to Trade
Never Miss A Trade Again

Signal Notification
Real-time signal notifications whenever a signal is opened, closes or Updated

Get Alerts
Immediate alerts to your email and mobile phone.

Entry Price Levels
Entry price level for every signal Just choose one of our Top Brokers in the list above to get all this free.