Quant Market Forecast: February 8
The Quant market forecast is for the price to complete its pullback towards the $125.25 demand level, after which a strong rally back to the $155.70 level is anticipated.
Quant Long-Term Trend: Bullish (1-Day Chart)
Key Levels:
Zones of supply: $155.70, $227.70, $260.00
Zones of Demand: $101.30, $115.00, $125.25
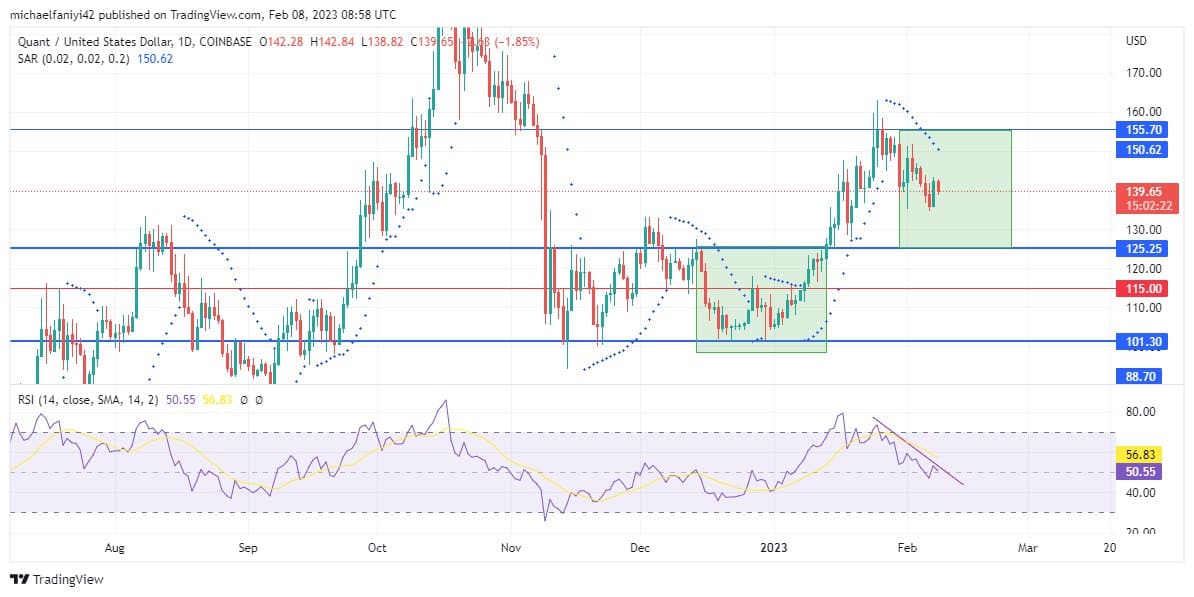
QNTUSD is anticipated to pull back to the $125.25 demand level after the resistance level has proven too obstinate to yield. The retracement of the market is similar to what happened in the consolidation between December and January. This led to a strengthening of the bulls and a strong breakout beyond the resistance level. Therefore, it is anticipated that buyers will also be pumped up for a rally by the time they touchdown at the $125.25 demand level.
Quant Price Forecast: QNT/USD Outlook
The buyers still have the upper hand in the market. The previous time Quant had to retrace before a rally was during the Dec-Jan consolidation, which led to an eventual breakout.
The market is likely adopting a similar strategy to get past an unyielding resistance level of $155.70. Therefore, the coin is predicted to eventually touchdown at $125.25 before a strong rally.
The Parabolic SAR (Stop and Reverse) indicator has its dots rightly aligned above the daily candlesticks as the market plunges toward the support level at $125.25.
QNT/USD Medium-Term Trend: Bullish (4-hour chart)
The RSI (Relative Strength Index) indicator on the daily chart has shown a clear-cut direction of a pullback. Its line has plunged from the overbought border into the middle line of its chart. Meanwhile, on the 4-hour chart, the RSI is undulating but still following a downtrend.
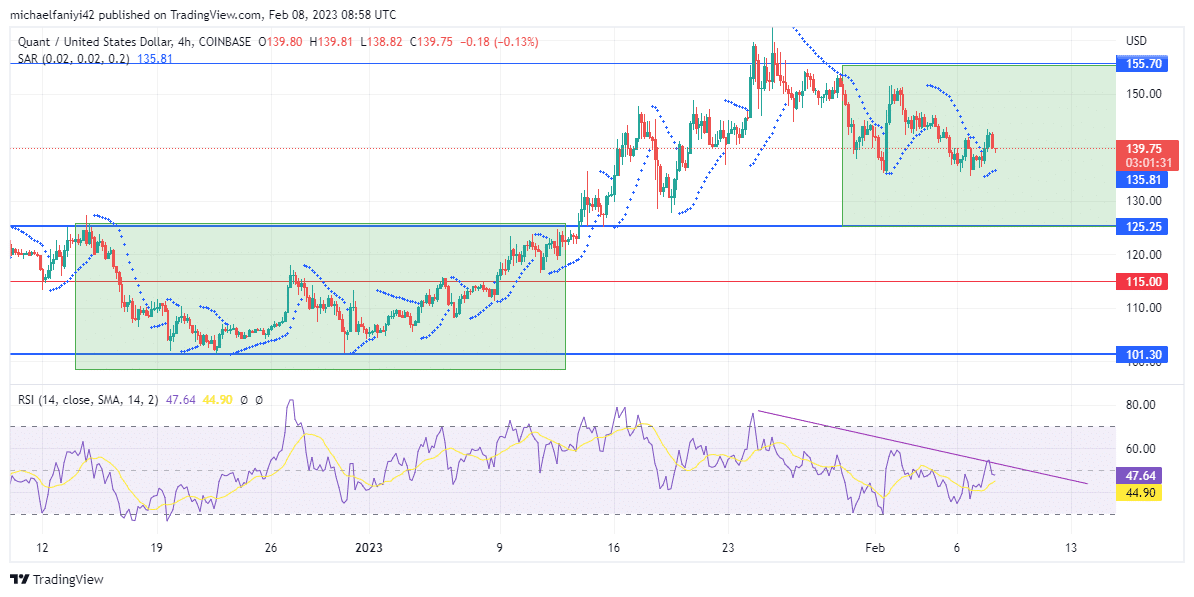
The Parabolic SAR dots are also alternating around the 4-hour candlesticks, but the dots align more above the candles than below. This is also a clear sign of market retracement. More buyers will be looking to hop on the market at the $125.25 demand level to further strengthen the price for a rally.
Place winning Quant trades with us. Get QNT here
Note: Learn2.trade is not a financial advisor. Do your research before investing your funds in any financial asset or presented product or event. We are not responsible for your investing results.
- Broker
- Min Deposit
- Score
- Visit Broker

- Award-winning Cryptocurrency trading platform
- $100 minimum deposit,
- FCA & Cysec regulated

- 20% welcome bonus of upto $10,000
- Minimum deposit $100
- Verify your account before the bonus is credited
- Fund Moneta Markets account with a minimum of $250
- Opt in using the form to claim your 50% deposit bonus
Learn to Trade
Never Miss A Trade Again

Signal Notification
Real-time signal notifications whenever a signal is opened, closes or Updated

Get Alerts
Immediate alerts to your email and mobile phone.

Entry Price Levels
Entry price level for every signal Just choose one of our Top Brokers in the list above to get all this free.