We have covered most of the important technical chart patterns in our strategy section. There are still some strategies left though. “Triangles” and “Wedges” are two of the 10 most important chart patterns and in this article we´ll explain how to trade them. It´s true that they are different patterns, but they are very similar so we´ll teach both of them in one article.
Our Forex Signals
1 - month
Subscription
 Up to 15 signals daily
76% success rate
Entry, take profit & stop loss
Amount to risk per trade
Risk reward ratio
Up to 15 signals daily
76% success rate
Entry, take profit & stop loss
Amount to risk per trade
Risk reward ratiomonth
3 - month
Subscription
Up to 15 signals daily
76% success rate
Entry, take profit & stop loss
Amount to risk per trade
Risk reward ratiomonth
 Most popular
6 - month
Subscription
 Up to 15 signals daily
76% success rate
Entry, take profit & stop loss
Amount to risk per trade
Risk reward ratio
Up to 15 signals daily
76% success rate
Entry, take profit & stop loss
Amount to risk per trade
Risk reward ratiomonth
Lifetime
Subscription
Up to 15 signals daily
76% success rate
Entry, take profit & stop loss
Amount to risk per trade
Risk reward ratioSeparate Swing Trading Group
Up to 15 signals daily
76% success rate
Entry, take profit & stop loss
Amount to risk per trade
Risk reward ratiomonth
1 - month
Subscription
Up to 15 signals daily
76% success rate
Entry, take profit & stop loss
Amount to risk per trade
Risk reward ratiomonth
3 - month
Subscription
Up to 15 signals daily
76% success rate
Entry, take profit & stop loss
Amount to risk per trade
Risk reward ratiomonth
Most popular
6 - month
Subscription
Up to 15 signals daily
76% success rate
Entry, take profit & stop loss
Amount to risk per trade
Risk reward ratiomonth
Lifetime
Subscription
Up to 15 signals daily
76% success rate
Entry, take profit & stop loss
Amount to risk per trade
Risk reward ratioSeparate Swing Trading Group
Up to 15 signals daily
76% success rate
Entry, take profit & stop loss
Amount to risk per trade
Risk reward ratiomonth
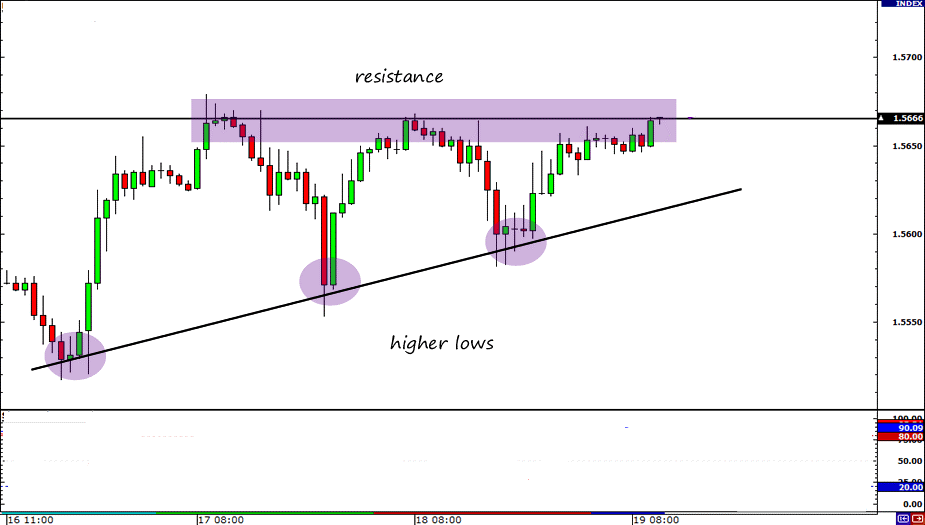
Apart from special occasions which are very rare, we all know that the price doesn´t go up or down in a straight line. Instead, it forms trends following different types of waves, as we have explained in the “Elliot Wave Strategy”. In an uptrend, the first leg goes up and then consolidates before starting the second leg, and vice versa for the downtrend.
3
Payment methods
Trading platforms
Regulated by
Support
Min.Deposit
Leverage max
Currency Pairs
Classification
Mobile App
Rating
Total cost
$ 0
![]() Commission
3.5
Commission
3.5
Min.Deposit
$100
Spread min.
Variables pips
Leverage max
100
Currency Pairs
40
Trading platforms
Funding Methods


Regulated by
FCA
What you can trade
Forex
Indices
Actions
Cryptocurrencies
Raw Materials
Average spread
EUR/GBP
-
EUR/USD
-
EUR/JPY
0.3
EUR/CHF
0.2
GBP/USD
0.0
GBP/JPY
0.1
GBP/CHF
0.3
USD/JPY
0.0
USD/CHF
0.2
CHF/JPY
0.3
Additional Fee
Continuous rate
Variables
Conversión
Variables pips
Regulation
Yes
FCA
No
CYSEC
No
ASIC
No
CFTC
No
NFA
No
BAFIN
No
CMA
No
SCB
No
DFSA
No
CBFSAI
No
BVIFSC
No
FSCA
No
FSA
No
FFAJ
No
ADGM
No
FRSA
71% of retail investor accounts lose money when trading CFDs with this provider.
Rating
Total cost
$ 0
![]() Commission
0
Commission
0
Min.Deposit
$100
Spread min.
- pips
Leverage max
400
Currency Pairs
50
Trading platforms
Funding Methods
Regulated by
CYSECASICCBFSAIBVIFSCFSCAFSAFFAJADGMFRSA
What you can trade
Forex
Indices
Actions
Cryptocurrencies
Raw Materials
Etfs
Average spread
EUR/GBP
1
EUR/USD
0.9
EUR/JPY
1
EUR/CHF
1
GBP/USD
1
GBP/JPY
1
GBP/CHF
1
USD/JPY
1
USD/CHF
1
CHF/JPY
1
Additional Fee
Continuous rate
-
Conversión
- pips
Regulation
No
FCA
Yes
CYSEC
Yes
ASIC
No
CFTC
No
NFA
No
BAFIN
No
CMA
No
SCB
No
DFSA
Yes
CBFSAI
Yes
BVIFSC
Yes
FSCA
Yes
FSA
Yes
FFAJ
Yes
ADGM
Yes
FRSA
71% of retail investor accounts lose money when trading CFDs with this provider.
Rating
Total cost
$ 0
![]() Commission
0.1
Commission
0.1
Min.Deposit
$50
Spread min.
- pips
Leverage max
500
Currency Pairs
40
Trading platforms
Funding Methods
What you can trade
Forex
Indices
Actions
Raw Materials
Average spread
EUR/GBP
-
EUR/USD
-
EUR/JPY
-
EUR/CHF
-
GBP/USD
-
GBP/JPY
-
GBP/CHF
-
USD/JPY
-
USD/CHF
-
CHF/JPY
-
Additional Fee
Continuous rate
-
Conversión
- pips
Regulation
No
FCA
No
CYSEC
No
ASIC
No
CFTC
No
NFA
No
BAFIN
No
CMA
No
SCB
No
DFSA
No
CBFSAI
No
BVIFSC
No
FSCA
No
FSA
No
FFAJ
No
ADGM
No
FRSA
71% of retail investor accounts lose money when trading CFDs with this provider.
During the consolidation period, the price forms a triangle or a wedge. In order to have a better view, you should change the charts to a smaller time frame.
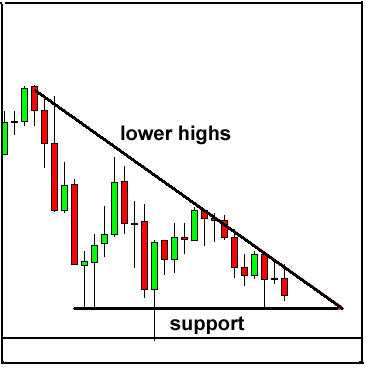
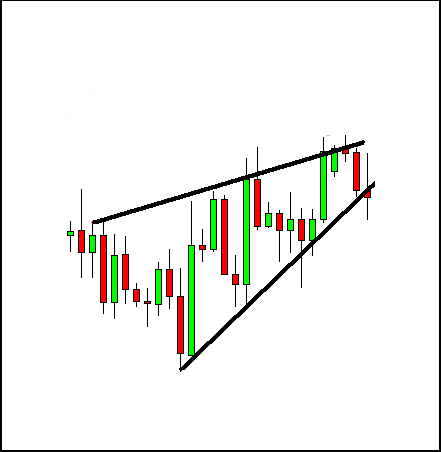
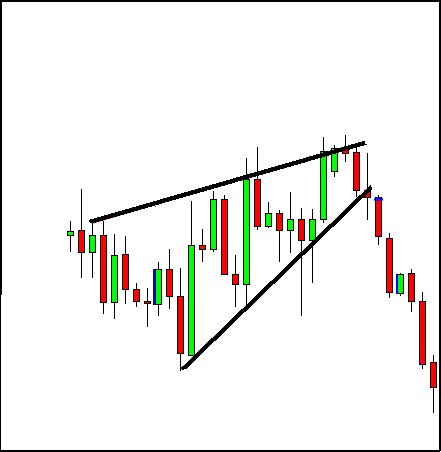
If you are trading 1-hour charts, when the consolidation begins to take place change to 5 or 15-minute charts and draw a trend line connecting the tops and another one connecting the bottoms of the price range during that consolidation. As the name indicates, a triangle is formed when the top and the bottom trend lines culminate in a single point, confining the price in between them. In a wedge, the price breaks out in either direction before the two trend lines meet. In the images below you can see a triangle and a wedge being formed.
Rising wedge

Asymmetrical rising wedge
Descending triangle
You can start trading a wedge or a triangle while it is being formed. As you can see from the first picture, the top and the bottom lines are providing resistance and support respectively.
You can draw the resistance line once the price has formed two peaks and you can draw the support line once the price has formed two lows. The second low should be higher than the first one in order to be considered a wedge or a triangle. The simplest and most obvious way to trade a wedge or a triangle is to trade between those two lines. You basically sell at the top line with a stop above the resistance and buy at the bottom line with a stop below the support.
This strategy works best in bigger time frame charts, like daily or 4-hour charts, because there´s more room between the lines. This way the profit target can be bigger and the reward/risk ratio is bigger too. If you trade smaller timeframe charts, you should choose a broker with small spreads and a fast execution.
That´s one way to take advantage of these chart formations, but the wedges and the triangles are most famous for indicating breakouts. In order to predict which way the breakout is going to happen, we should know the types of these chart patterns. There are three types of wedges and triangles: ascending wedge/triangle, descending wedge/triangle and symmetrical wedge/triangle.
Ascending Wedge/Triangle
The price is forming an ascending wedge
Price breaks the top line which turns into resistance
Descending Wedge/Triangle
The descending wedges and triangles are the opposite of the ascending ones and become valid after a downtrend. So instead of selling after the break of the bottom line, you buy after the top line gives way. When you trade these patterns, the profit target you aim for should be as big as the space between the first top and the first bottom of the range, as shown in the second chart below. The reason I´m saying the first top and the first bottom is because there are occasions when neither of the two lines of the wedge is horizontal, like the ascending one above.
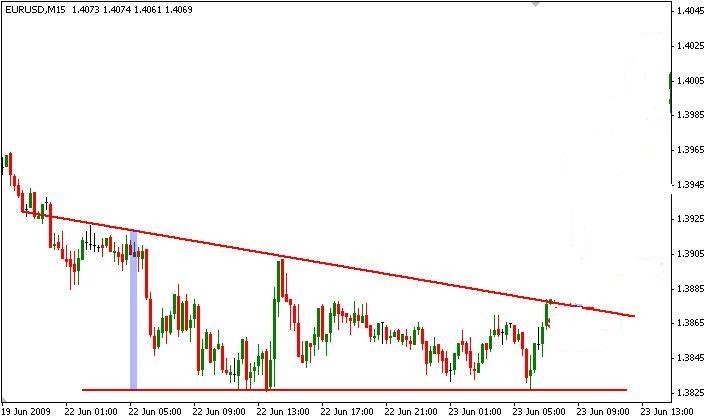
Descending wedge is being formed after a downtrend
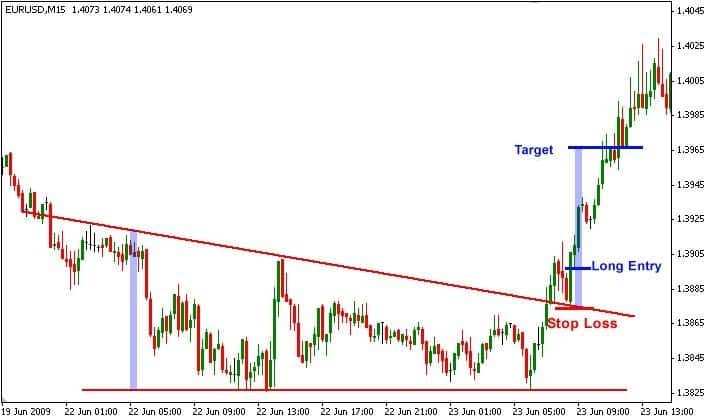
After the break to the upside the target is as big as the space between the first top and the first bottom.
Symmetrical Wedge/Triangle
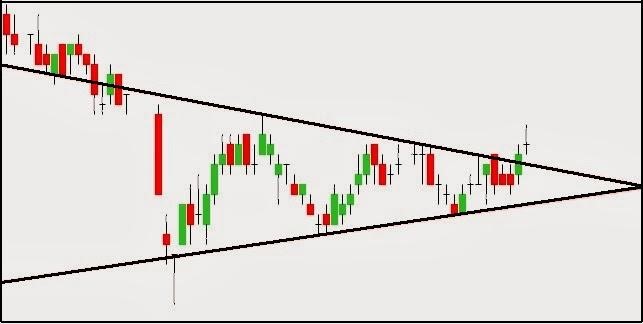
In a symmetrical triangle, you can trade between the two lines and after the breakout
During these formations, the bulls and the bears are putting up a bitter fight, until one side eventually gives up. It doesn´t matter if this consolidation takes place after an uptrend or a downtrend. When you use ascending and descending wedge or triangle chart patterns for trading, you know which way the price will go after the breakout, but symmetrical wedges and triangles don´t give you a clear direction. That doesn´t mean you cannot trade them though; you can trade them in the same way you trade rising and falling wedges/triangles. You buy and sell while the price is bouncing inside the two lines of the triangle. And of course, you can trade the breakout in either side by placing a stop buy or a stop sell order above and below the triangle.
I personally fancy opening a trade after the price breaks and retests one of the lines.