Previously, we published an article where we explained the development and workings of the Elliot Wave Theory. This principle is useless unless implemented in everyday trading. In this article, we will explain how to successfully trade with the Elliot Wave Theory (EWT).
Our Forex Signals
1 - month
Subscription
 Up to 15 signals daily
76% success rate
Entry, take profit & stop loss
Amount to risk per trade
Risk reward ratio
Up to 15 signals daily
76% success rate
Entry, take profit & stop loss
Amount to risk per trade
Risk reward ratiomonth
3 - month
Subscription
Up to 15 signals daily
76% success rate
Entry, take profit & stop loss
Amount to risk per trade
Risk reward ratiomonth
 Most popular
6 - month
Subscription
 Up to 15 signals daily
76% success rate
Entry, take profit & stop loss
Amount to risk per trade
Risk reward ratio
Up to 15 signals daily
76% success rate
Entry, take profit & stop loss
Amount to risk per trade
Risk reward ratiomonth
Lifetime
Subscription
Up to 15 signals daily
76% success rate
Entry, take profit & stop loss
Amount to risk per trade
Risk reward ratioSeparate Swing Trading Group
Up to 3 signals weekly
76% success rate
Entry, take profit & stop loss
Amount to risk per trade
Risk reward ratiomonth
1 - month
Subscription
Up to 15 signals daily
76% success rate
Entry, take profit & stop loss
Amount to risk per trade
Risk reward ratiotime
1 - month
Subscription
Up to 15 signals daily
76% success rate
Entry, take profit & stop loss
Amount to risk per trade
Risk reward ratiomonth
3 - month
Subscription
Up to 15 signals daily
76% success rate
Entry, take profit & stop loss
Amount to risk per trade
Risk reward ratiomonth
Most popular
6 - month
Subscription
Up to 15 signals daily
76% success rate
Entry, take profit & stop loss
Amount to risk per trade
Risk reward ratiomonth
Lifetime
Subscription
Up to 15 signals daily
76% success rate
Entry, take profit & stop loss
Amount to risk per trade
Risk reward ratioSeparate Swing Trading Group
Up to 3 signals weekly
76% success rate
Entry, take profit & stop loss
Amount to risk per trade
Risk reward ratiomonth
1 - month
Subscription
Up to 15 signals daily
76% success rate
Entry, take profit & stop loss
Amount to risk per trade
Risk reward ratiotime
To recap, when you use EWT you trade the probability which this system offers; you can trade based solely upon on this theory, buying after every retracing wave and selling at the top of the trend waves. But, in order to increase the probability of success, you should add at least one extra indicator to the strategy. You can combine the EWT with many indicators, but I personally find the Fibonacci indicator, moving averages, support/resistance levels, and Stochastics/RSI indicators most reliable.
3
Payment methods
Trading platforms
Regulated by
Support
Min.Deposit
Leverage max
Currency Pairs
Classification
Mobile App
Rating
Total cost
$ 0
![]() Commission
3.5
Commission
3.5
Min.Deposit
$100
Spread min.
Variables pips
Leverage max
100
Currency Pairs
40
Trading platforms
Funding Methods


Regulated by
FCA
What you can trade
Forex
Indices
Actions
Cryptocurrencies
Raw Materials
Average spread
EUR/GBP
-
EUR/USD
-
EUR/JPY
0.3
EUR/CHF
0.2
GBP/USD
0.0
GBP/JPY
0.1
GBP/CHF
0.3
USD/JPY
-
USD/CHF
0.2
CHF/JPY
0.3
Additional Fee
Continuous rate
Variables
Conversión
Variables pips
Regulation
Yes
FCA
No
CYSEC
No
ASIC
No
CFTC
No
NFA
No
BAFIN
No
CMA
No
SCB
No
DFSA
No
CBFSAI
No
BVIFSC
No
FSCA
No
FSA
No
FFAJ
No
ADGM
No
FRSA
71% of retail investor accounts lose money when trading CFDs with this provider.
Rating
Total cost
$ 0
![]() Commission
0
Commission
0
Min.Deposit
$100
Spread min.
- pips
Leverage max
400
Currency Pairs
50
Trading platforms
Funding Methods
Regulated by
CYSECASICCBFSAIBVIFSCFSCAFSAFFAJADGMFRSA
What you can trade
Forex
Indices
Actions
Cryptocurrencies
Raw Materials
Etfs
Average spread
EUR/GBP
1
EUR/USD
0.9
EUR/JPY
1
EUR/CHF
1
GBP/USD
1
GBP/JPY
1
GBP/CHF
1
USD/JPY
-
USD/CHF
1
CHF/JPY
1
Additional Fee
Continuous rate
-
Conversión
- pips
Regulation
No
FCA
Yes
CYSEC
Yes
ASIC
No
CFTC
No
NFA
No
BAFIN
No
CMA
No
SCB
No
DFSA
Yes
CBFSAI
Yes
BVIFSC
Yes
FSCA
Yes
FSA
Yes
FFAJ
Yes
ADGM
Yes
FRSA
71% of retail investor accounts lose money when trading CFDs with this provider.
Rating
Total cost
$ 0
![]() Commission
0.1
Commission
0.1
Min.Deposit
$50
Spread min.
- pips
Leverage max
500
Currency Pairs
40
Trading platforms
Funding Methods
What you can trade
Forex
Indices
Actions
Raw Materials
Average spread
EUR/GBP
-
EUR/USD
-
EUR/JPY
-
EUR/CHF
-
GBP/USD
-
GBP/JPY
-
GBP/CHF
-
USD/JPY
-
USD/CHF
-
CHF/JPY
-
Additional Fee
Continuous rate
-
Conversión
- pips
Regulation
No
FCA
No
CYSEC
No
ASIC
No
CFTC
No
NFA
No
BAFIN
No
CMA
No
SCB
No
DFSA
No
CBFSAI
No
BVIFSC
No
FSCA
No
FSA
No
FFAJ
No
ADGM
No
FRSA
71% of retail investor accounts lose money when trading CFDs with this provider.
In this article, we will explain how to combine the EWT with these indicators. We know that market moves are not very symmetrical, and it is often hard to determine if an Elliot wave is completed.These indicators help us to define entry and exit points.
Trading the Elliot Wave Principle with the Fibonacci retracement levels
The Fibonacci indicator is one of the most popular indicators to combine with the EWT. The Fibonacci indicator defines the retracement levels. According to this strategy, as in nature, the market follows a golden rule where certain ratios or numbers play a big role. When we trade with the Elliott wave theory, we can use these Fibonacci numbers to determine the end or the beginning of the smaller waves, as well as the larger impulsive and corrective phases.
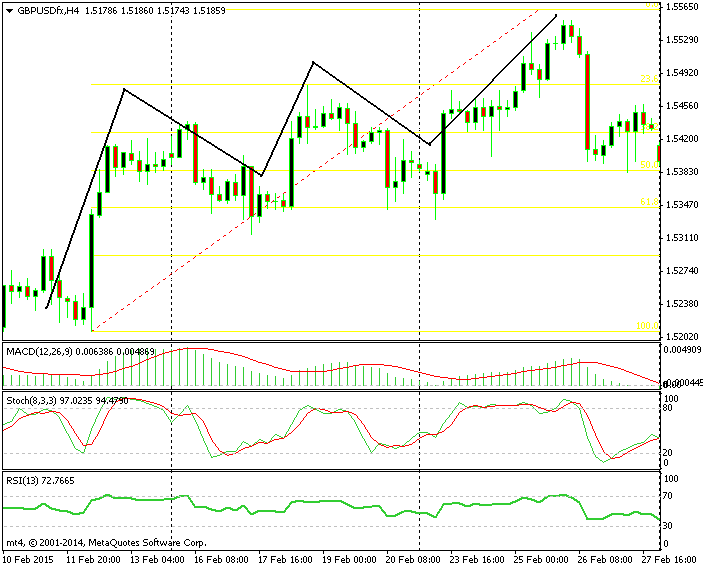
The Fibonacci levels have defined the tops and bottoms of the five waves in a strong uptrend.
The golden ratio numbers are 0.236, 0.382, 0.5, 0.618 and 0.764. Since there are five, they are perfect for the five waves in the impulsive phase. If you spot an uptrend, you wait for the retrace to be over and then you can start the implementation of the strategy. You draw the lines according to the Fibonacci numbers from top to bottom of the previous trend. The MertaTrader software offers this indicator on the easy-to-use platform; click on the indicator, then click at the bottom of the trend and drag to the top. A line will appear in every Fibonacci number so it is visually clear and simple to use.
When the first Elliot wave begins after the larger downtrend retrace, it will normally break the 0.236 line and reach the 0.382 line. By that time, the first wave will be over and the second retracing wave will start to form, which will find support and finish at the previous 0.236 level. You can trade this way for the motive phase of the Elliot wave pattern during a mild uptrend, buying at the lower Fibonacci level and selling at the higher one. When an uptrend or downtrend is steeper, the price might jump double for a single wave, so it is important to consider the strength of the trend. For the three waves of the corrective phase, we can use only the 0.382, 0.5 and 0.618 numbers, which are the most important.
For a quick recap on Fibonacci levels: Fibonacci Indicator – Forex Trading Strategies
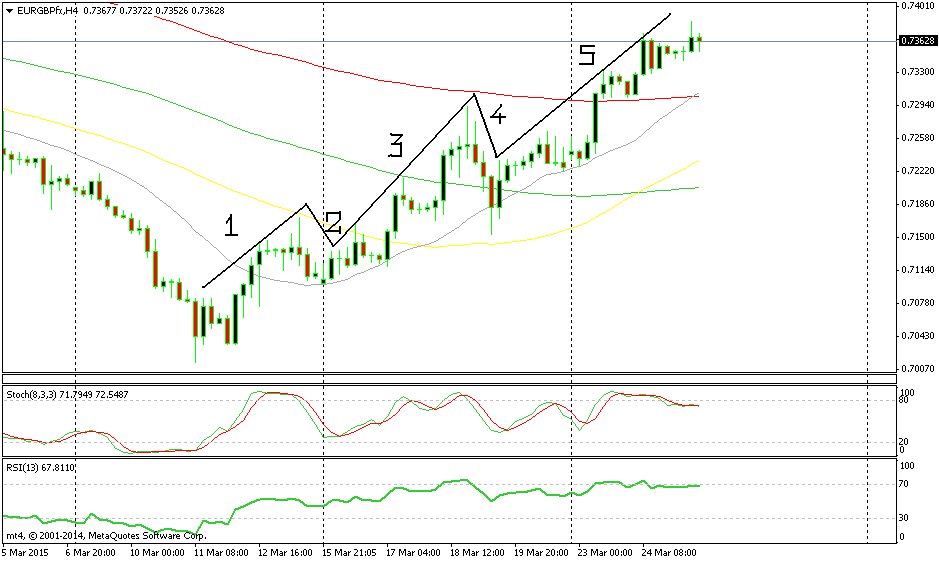
The moving averages stand at the top and the bottom of every wave.
Trading the Elliot wave principle with moving averages
The moving average is a very adaptable solid indicator, that´s why it is one of my favorite indicators. You can implement it in many trading strategies and combine it with many other indicators in order to increase the probability of success. I often use 3 to 5 moving averages for different periods, so they come in handy to trade with the EWT.
In uptrends, the moving averages act as resistance and cap the price, resulting in the end of the upward waves. After a moving average is breached, another one takes its place to provide resistance. The breached average now turns into support, limiting the corrective downward waves.
The picture below illustrates how the moving averages and the Elliot wave theory work hand-in-hand. The yellow 50 MA stops the move upward, thus ending the first wave and starting the second corrective wave. The 20 MA in gray now turns into support and holds the price from moving lower, which means that the second wave is over. In the third wave, the 100 MA in red comes into play and the wave fades when the price gets close to it. After that, the fourth wave commences and ends only when it reaches an area where there´s a confluence of the 20, 50 and 100 moving averages which have now turned into support. Then starts the final wave, which takes the price above the 100 smooth MA in red.
You can also trade the Elliot wave theory with moving averages by using the moving average to identify the start of a new wave. The small period moving averages like 5 MA, 8 MA, 10 MA or 20 MA work best for this strategy. Basically, you wait until the price moves above or below the moving average, which confirms that the new wave has started. You can open a position in that direction immediately after the break, but there´s the risk of a fake-out. So I prefer to wait until the price retraces back to the moving average and then sell with a stop – either above the moving average or above the previous wave´s high in a downtrend.
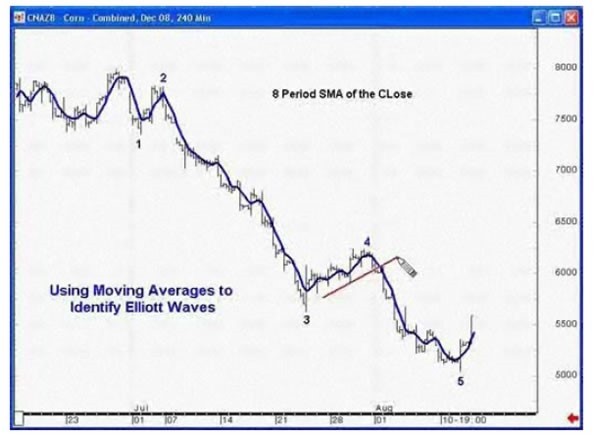
A wave starts after the price crosses over the moving average.
To refresh your memory about moving averages: Trading Moving Averages – Forex Trading Strategies
Trading the Elliot wave principle with support and resistance levels
Support and resistance levels are widely used in trading. They are easy to see, so a lot of people base their entries and exits on them. They can be used in range trading, but in the case of the Elliot wave theory, they are used in trend trading. This method is similar to the Darvas Box system.
As we know, in an uptrend, once a resistance level is broken, it turns into support. So when an upward wave of this pattern breaks above a resistance level, the next corrective wave is supported by the previous resistance. This means that this level will be the end of the second wave; we can buy here with a stop either below the resistance or below the starting level of the first wave. The opposite applies to a downtrend Elliot wave pattern.
The downside to this method is that you can only start trading after the end of the second wave. You can see in the chart below that the top of the first wave provides resistance, turns into support and holds the price at the bottom of the fourth wave of the motive phase (Fig. 4). In the corrective phase, it provides support and forms the bottom of the A wave.
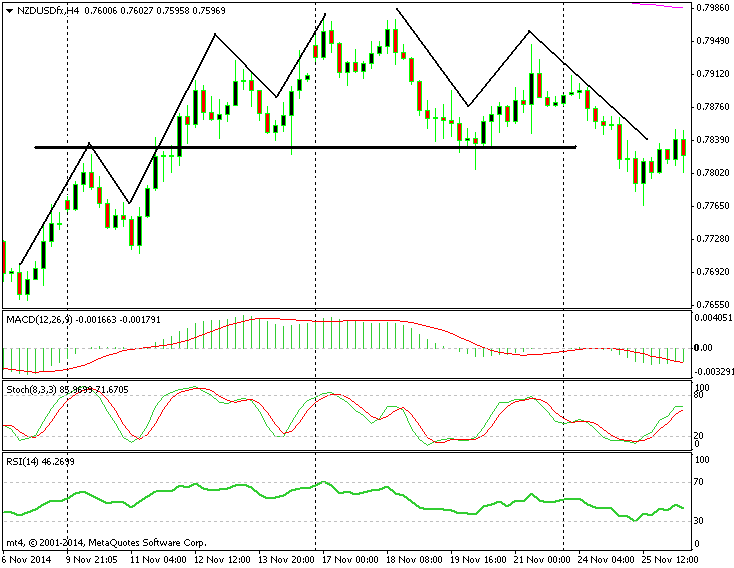
The resistance level of the first wave provides support in the fourth wave of the motive phase, as well as in the first wave of the corrective phase
To review Support and Resistance Levels: Support and Resistance Levels – Forex Trading Strategies
Trading the Elliot wave principle with Stochastic and RSI indicators
RSI is another very popular indicator amongst professional traders. However, I prefer the Stochastic indicator. Though it is similar to RSI, in my opinion, it works better. It signals tops and bottoms faster than RSI. They are both easy to read and interpret; you buy when the indicators reach the oversold area (30 for RSI and 20 for Stochastic), and sell when they reach the overbought area at 70 for RSI and 80 for Stochastic.
You can do the same when you apply these indicators to the Elliot wave theory. When these indicators are overbought it means that the up wave is over, therefore, you have to sell. When the indicators are oversold it means that the retracing wave is over and you can buy in order to ride the next wave up.
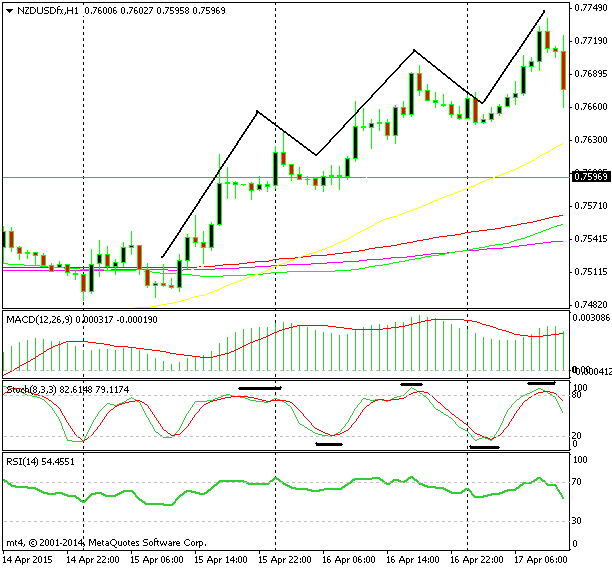
The Elliot wave pattern working well when combined with Stochastics
The chart above explains this strategy very clearly; as you can see the Stochastic is a very good indicator. Rinse and repeat five times for each of the five waves of the impulsive phase. Then do the same with the three waves of the corrective phase. Even though the difference between the overbought and the oversold levels in these two indicators is always the same, in an uptrend pattern the waves are faster, thus the price gains are bigger by the time the Stochastic and RSI reach the overbought levels. You apply the same method but in the opposite direction in a downtrend Elliot wave pattern.
We know that most of the trends happen in waves, so the Elliot wave theory is very useful. But in order to turn it into a strategy, you have to combine it with other indicators like the ones explained above. If I rank the indicators depending on how well they work with the EWT, in my opinion, it would go like this:
- EW with moving averages
- EW with Stochastics and RSI
- EW with support/resistance levels and
- EW with Fibonacci
If you look at the charts above you can see that I keep most of these indicators on, so I don´t have to guess or chose one strategy over the other. I just see how the waves progress and which indicator works at the moment for that particular pattern, so I suggest that you do the same.