Looking at cloud-based indicators such as Ichimoku.
Our Forex Signals
1 - month
Subscription
 Up to 15 signals daily
 76% success rate
 Entry, take profit & stop loss
 Amount to risk per trade
 Risk reward ratio
month
3 - month
Subscription
 Up to 15 signals daily
 76% success rate
 Entry, take profit & stop loss
 Amount to risk per trade
 Risk reward ratio
month
 Most popular
6 - month
Subscription
 Up to 15 signals daily
 76% success rate
 Entry, take profit & stop loss
 Amount to risk per trade
 Risk reward ratio
month
Lifetime
Subscription
 Up to 15 signals daily
 76% success rate
 Entry, take profit & stop loss
 Amount to risk per trade
 Risk reward ratio
Separate Swing Trading Group
 Up to 3 signals weekly
 76% success rate
 Entry, take profit & stop loss
 Amount to risk per trade
 Risk reward ratio
month
1 - month
Subscription
 Up to 15 signals daily
 76% success rate
 Entry, take profit & stop loss
 Amount to risk per trade
 Risk reward ratio
time
What Is Ichimoku Trading?
The Ichimoku trading strategy is an abbreviation of “Ichimoku Kinko Hyo,” developed by Japanese journalist Goichi Hosoda in the 1960s. This technique has been popular in Japan for quite some time, gaining popularity in other parts of the world as well.
3
Payment methods
Trading platforms
Regulated by
Support
Min.Deposit
Leverage max
Currency Pairs
Classification
Mobile App
Min.Deposit
$100
Spread min.
Variables pips
Leverage max
100
Currency Pairs
40
Trading platforms
Funding Methods


Regulated by
FCA
What you can trade
Forex
Indices
Actions
Cryptocurrencies
Raw Materials
Average spread
EUR/GBP
-
EUR/USD
-
EUR/JPY
0.3
EUR/CHF
0.2
GBP/USD
0.0
GBP/JPY
0.1
GBP/CHF
0.3
USD/JPY
-
USD/CHF
0.2
CHF/JPY
0.3
Additional Fee
Continuous rate
Variables
Conversión
Variables pips
Regulation
Yes
FCA
No
CYSEC
No
ASIC
No
CFTC
No
NFA
No
BAFIN
No
CMA
No
SCB
No
DFSA
No
CBFSAI
No
BVIFSC
No
FSCA
No
FSA
No
FFAJ
No
ADGM
No
FRSA
71% of retail investor accounts lose money when trading CFDs with this provider.
Min.Deposit
$100
Spread min.
- pips
Leverage max
400
Currency Pairs
50
Trading platforms
Funding Methods


Regulated by
CYSECASICCBFSAIBVIFSCFSCAFSAFFAJADGMFRSA
What you can trade
Forex
Indices
Actions
Cryptocurrencies
Raw Materials
Etfs
Average spread
EUR/GBP
1
EUR/USD
0.9
EUR/JPY
1
EUR/CHF
1
GBP/USD
1
GBP/JPY
1
GBP/CHF
1
USD/JPY
-
USD/CHF
1
CHF/JPY
1
Additional Fee
Continuous rate
-
Conversión
- pips
Regulation
No
FCA
Yes
CYSEC
Yes
ASIC
No
CFTC
No
NFA
No
BAFIN
No
CMA
No
SCB
No
DFSA
Yes
CBFSAI
Yes
BVIFSC
Yes
FSCA
Yes
FSA
Yes
FFAJ
Yes
ADGM
Yes
FRSA
71% of retail investor accounts lose money when trading CFDs with this provider.
Min.Deposit
$50
Spread min.
- pips
Leverage max
500
Currency Pairs
40
Trading platforms
Funding Methods


What you can trade
Forex
Indices
Actions
Raw Materials
Average spread
EUR/GBP
-
EUR/USD
-
EUR/JPY
-
EUR/CHF
-
GBP/USD
-
GBP/JPY
-
GBP/CHF
-
USD/JPY
-
USD/CHF
-
CHF/JPY
-
Additional Fee
Continuous rate
-
Conversión
- pips
Regulation
No
FCA
No
CYSEC
No
ASIC
No
CFTC
No
NFA
No
BAFIN
No
CMA
No
SCB
No
DFSA
No
CBFSAI
No
BVIFSC
No
FSCA
No
FSA
No
FFAJ
No
ADGM
No
FRSA
71% of retail investor accounts lose money when trading CFDs with this provider.
Ichimoku Kinko Hyo means “instant look at the balance chart”. Based on other charting indicators like candlesticks and moving averages, it is considered to be a technical strategy. Basically, Ichimoku trading involves a group of indicators or strategies that identify the prevailing trend. It uses multiple-point moving averages that are calculated based on the median price of the candlesticks or (high+low)/2.

Goichi Hosoda: Developer of Ichimoku Trading
The Six Components Of The Ichimoku Indicator
Tenkan Sen (red line): Calculated as the middle price for the last 9 candlestick highs-lows. This is an important line in Ichimoku trading because it is an early indicator of the trend. There´s no trend when this line is horizontal but once it takes a direction it is very likely that a trend has begun.
Kijun Sen (blue line): This line follows the last 26 candlesticks. It is slower than the red line so it moves with a time lag. The blue line is used as an indicator of trends.
Senoku span A (green interrupted edge of the cloud): This forms one of the edges of the Kuomo cloud and is the fastest moving line. Seen here crossing over the other; shifting the cloud at its squeezing point. It is calculated as a sum of the two sen lines, divided by two and then plotted 26 periods in advance.
Senoku span B (red interrupted edge of the cloud): This line is the lower edge of the cloud and it is calculated as the average of the high/low of the last 562 candlesticks. It is plotted 26 periods in advance as well, and that’s the reason the cloud stretches further than the last price candlestick.
Kuomo cloud (the gridded area): The space between the two Senoku span lines is called the Kuomo cloud. This cloud changes shape — when the market trades in a horizontal range the cloud is thinner, and when the market is trendy the cloud widens. The stronger the trend the greater the cloud width.
Chikou span (wrinkled green line): This is a lagging indicator because it is calculated by projecting 26 days from today’s closing price. The Chikou span indicates a trend in the same direction that crosses over where the price occurs, earning it the nickname “momentum line.”
Applying The Ichimoku Indicator
On the chart below there is a straighter green line which comes up automatically on the MT4 platform when you add the Ichimoku indicator. While it is not considered a true indicator, it can be very useful to integrate it within the Ichimoku trading strategy. We’ll elaborate on this below.
The figure below is the EUR/AUD weekly chart where we see the Ichimoku indicator.

As we explained above, there are many smaller indicators within the more complex Ichimoku indicator. These are more than enough to build several trading strategies, either individually or in combination.
Since the Ichimoku is a trend indicator, it is most effective in trending markets. It may be used in all time frame charts as well. Let’s start by explaining the strategies that each component offers the trader, starting with the leading indicators.
The tenkan sen and the kijun sen are both moving averages. One of the most popular strategies offered by normal moving averages is the crossover. This is the primary Ichimoku trading strategy of these two lines and of the leading indicator.
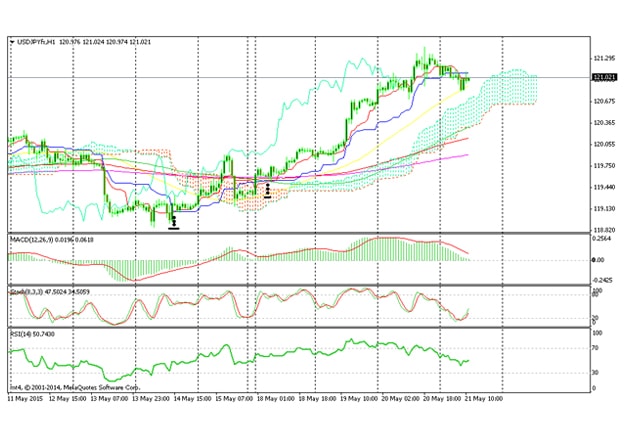
As we can see on the USD/JPY chart above the black dots, the first signal of a possible trend reversal is when the tankan sen (trigger line) crosses over the kijun sen (baseline). This signal alone is enough for the most daring traders to open a buy position. But I prefer to get further confirmation before jumping in feet first.
The main component of the Ichimoku indicator is the cloud. As we said above, the cloud widens when the trend strengthens and minimizes when there is a weak trend. It also changes colors, red when the price is in a downtrend and green when the price is up. These are the default settings but you can always change them.
The main purpose of the cloud is to indicate the trend. If price is above the cloud then we are in an uptrend and vice versa. So, the ultimate confirmation that this indicator offers is price crossing over the cloud.

The Two MA Crossovers Are Buy Signals
I still hesitate to enter a trade immediately after the price breaks above the cloud. Instead, I prefer to sit on the sidelines and wait until the price retraces. This way I can define the risk better and minimize it by placing the stop loss below the lower line of the cloud. After getting in, you can ride the uptrend as long as the price remains above the cloud and the cloud is green. I usually add to the position on the retraces to the tenkan and the kijun lines and trace the original stop below these two lines.
The crossover strategy of these two lines can be applied before the price moves above the cloud. However, the safest way is to use this strategy is after price has crossed the cloud, as you can see on the chart above the second black mark.
Last but not least is the Chickou span line which serves as a momentum indicator. Adding this line to the Ichimoku trading strategy might seem a little complicated but it’s actually quite simple. Since it is a lagging indicator, it acts as trade confirmation. The Japanese traders that implement Ichimoku trading methodology consider this to be the main component. They view the Chickou as confirmation after price has moved above the cloud and the crossover of the tenkan and the kijun lines has occurred.
This strategy is for the more conservative traders and requires patience as it lags price action. It is most effective on the longer period time-frames because you can get whipsawed if you use it on the smaller time-frame charts. You can also add extra indicators to the chart, such as longer period moving averages and a Stochastic. You can combine them with the Ichimoku indicator for an added probability of success.
Summary
The Ichimoku indicator has 5-6 smaller indicators built within, which can be used to form several trading strategies. With so many indicators you have several signals, starting from leading signals to lagging, so you have multiple chances to enter a trade. Ichimoku trading can be used by the impulsive traders who jump in after their leading signal, as well as those traders who are more reserved and prefer to have more than one confirmation before entering a trade.


