Origin Protocol, which launched around the 14th of last month, has made it into the top three crypto movers for today. This coin has only moved by 1.40% today. Nevertheless, examining this crypto closely reveals that the perceived profit may increase.
Origin Protocol Analysis Data:
OGN’s value now: $0.1247
Origin Protocol Market Cap: $63.8 million
OGN Moving Supply: 509.6 million
OGN Supply: 1,000,000,000
Origin CoinMarketCap ranking: 359
Major Price Levels:
Top: $0.1247, $0.1297, and $0.1342
Base: $0.1200, $0.1150, and $0,1100
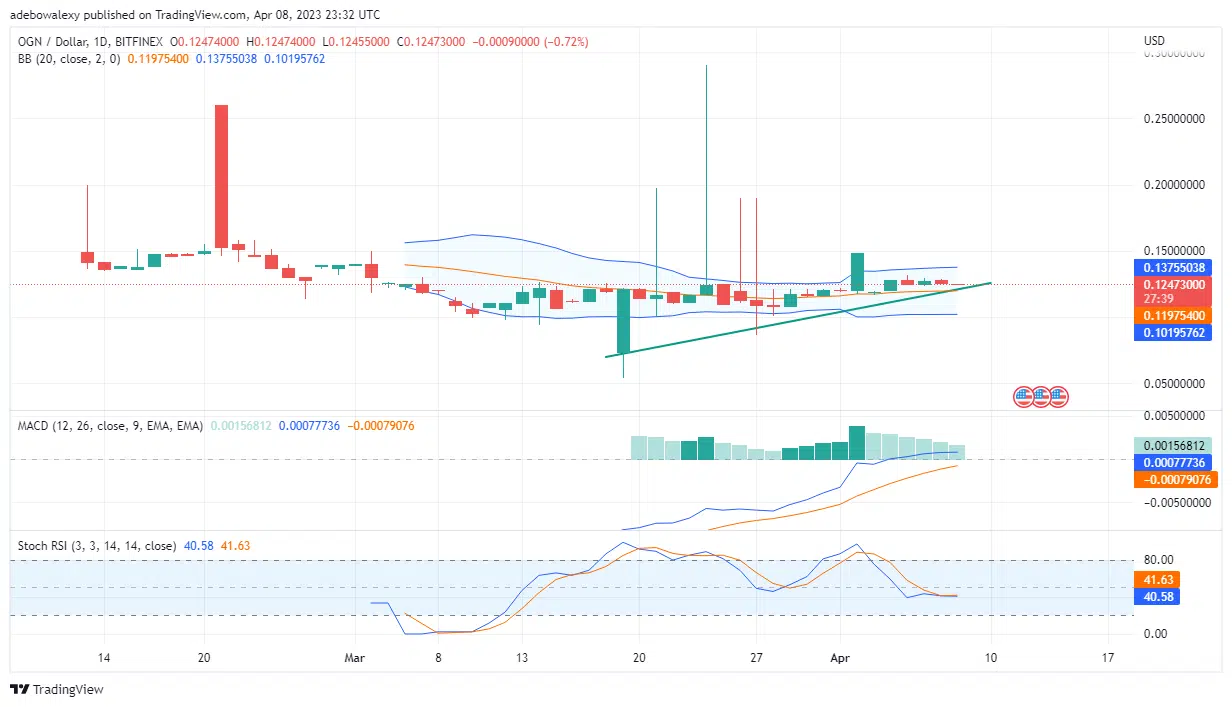
Origin Protocol (OGN) Price Action Is Trying to Stay on Higher Grounds Despite Headwinds
Price action in the OGN/USD daily market has been facing a headwind since five trading sessions ago. Then, the price candle had priced through the upper limit of the Bollinger Bands indicator, and in the following session, buyers started going short, and prices dropped significantly. However, at this point, the last red price candle on this chart stays above the middle limit of the Bollinger Bands indicator. Also, the lines of the Moving Average Convergence Divergence indicator (MACD) are still rising steadily toward crossing the equilibrium line to the upside. Nevertheless, the bars of the MACD are suggesting that buyers are losing momentum. Meanwhile, the Relative Strength Index (RSI) indicator line remains glued to each other and is moving sideways. This implies that price movements currently lack direction.
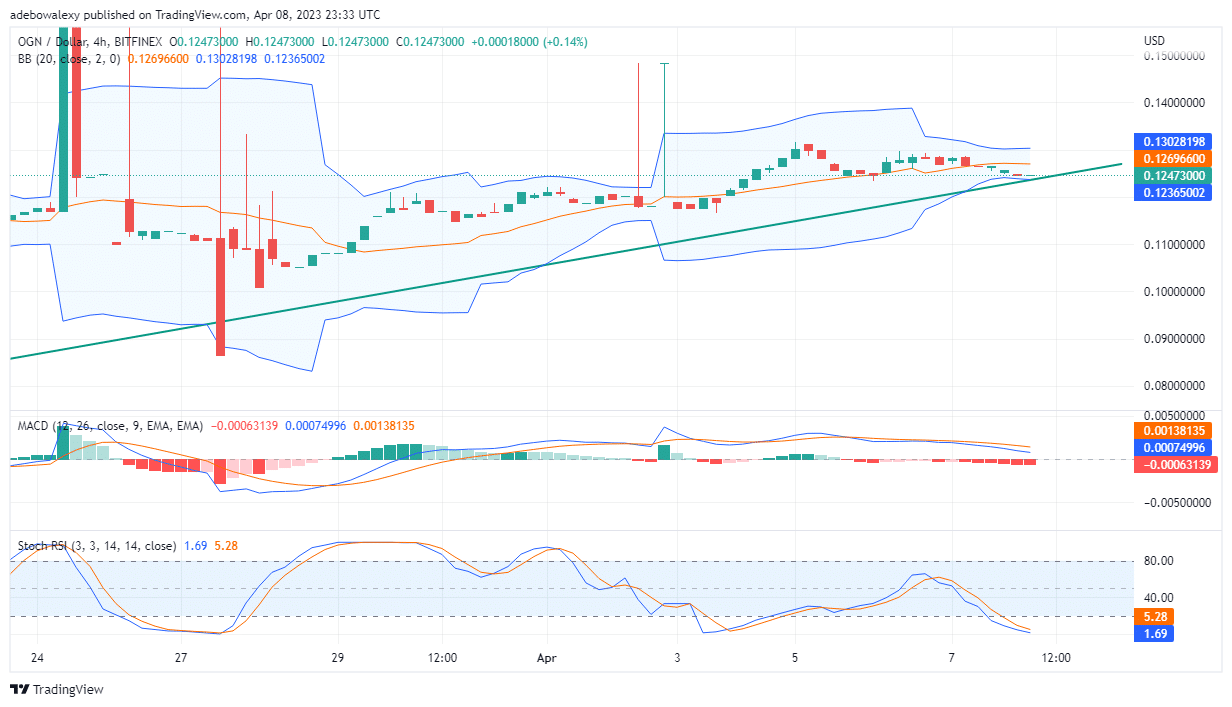
The Origin Protocol (OGN) Market Seems to Be Presenting Some Optimism
The last price candle on the OGN/USD 4-hour market is a green dashed-shaped price candle. Also, this last price candle is appearing at the lower limit of the Bollinger Bands. Additionally, Bollinger Bands are contracting, and such behavior of this indicator suggests that the market may be about to move significantly in one direction. Meanwhile, the MACD curves are above the equilibrium level but are moving slightly downward. Also, one can observe that the RSI indicator curves are closing in on each other in the oversold region. Therefore, it’s more likely that the recorded gain may keep growing towards the $0.1280 price mark shortly.
- Broker
- Min Deposit
- Score
- Visit Broker

- Award-winning Cryptocurrency trading platform
- $100 minimum deposit,
- FCA & Cysec regulated

- 20% welcome bonus of upto $10,000
- Minimum deposit $100
- Verify your account before the bonus is credited
- Fund Moneta Markets account with a minimum of $250
- Opt in using the form to claim your 50% deposit bonus
Learn to Trade
Never Miss A Trade Again

Signal Notification
Real-time signal notifications whenever a signal is opened, closes or Updated

Get Alerts
Immediate alerts to your email and mobile phone.

Entry Price Levels
Entry price level for every signal Just choose one of our Top Brokers in the list above to get all this free.