LTC/USD Key Levels:
Resistance Levels: 286.38, 244.20
Support Levels: 210.73, 189.88
Litecoin reached its highest price this year at $335.35 after which it has continued to fall successively. The price has dropped consecutively for eight days without a pause. It has actively struck the borders of the descending channel on both sides as it plunges.

Litecoin drove down into a support level at 210.73 on the 26th of April and has bounced higher currently showing a strong bullish candle within the descending channel. The price is currently at a resistance zone at 244.25. It has been consolidating on the four-hour chart between the resistance zone 244.25 and the support zone 210.73
The strength of the previous day support level may push the price to break through the descending channel beyond the resistance zone to aim for $286.38. The price might also just bounce off the 244.25 zone back into the descending channel. Though the current trend is bearish, a breakout and a possible retest of the key zone can be anticipated to change the trend.
Parabolic SAR still maintains an overhead position for Litecoin candles. The Parabolic SAR shows a strong pull for price to keep falling as it rests confidently over the bearish candles on the daily chart on the daily chart. The Parabolic SAR has shown a point under the bullish candles which is a reflection of the bounce of the 211.03 support level on the four-hour chart.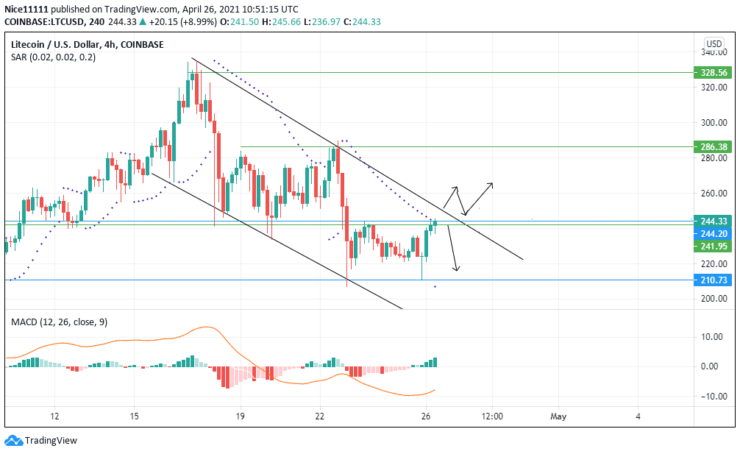
On the four-hour chart, the MACD signal line is already below 0 level showing the bearish run. It slightly points up from below the 0 level reflecting today’s bullishness.
- Broker
- Min Deposit
- Score
- Visit Broker

- Award-winning Cryptocurrency trading platform
- $100 minimum deposit,
- FCA & Cysec regulated

- 20% welcome bonus of upto $10,000
- Minimum deposit $100
- Verify your account before the bonus is credited
- Fund Moneta Markets account with a minimum of $250
- Opt in using the form to claim your 50% deposit bonus
Learn to Trade
Never Miss A Trade Again

Signal Notification
Real-time signal notifications whenever a signal is opened, closes or Updated

Get Alerts
Immediate alerts to your email and mobile phone.

Entry Price Levels
Entry price level for every signal Just choose one of our Top Brokers in the list above to get all this free.