GALA/USD price action has increased by 4.05%, yet the price movements of this crypto appear bearish despite the gains. Technical indicators used in analyzing this market, are also indicating more bearish price movements. may be witnessed in this market. Let’s zoom in for a closer look.
GALA Analysis Data
GALA Value Now: $0.02732
GALA Market Cap: $191M
GALA Moving Supply: 6,977,205,436
GALA Total Supply: 24,011,895,724.18
CoinMarketCap Ranking: 142
Major Price Levels:
Top: $0.02732, $0.02800, and $0.02850
Base: $0.02700, $0.02650, and $0.02600
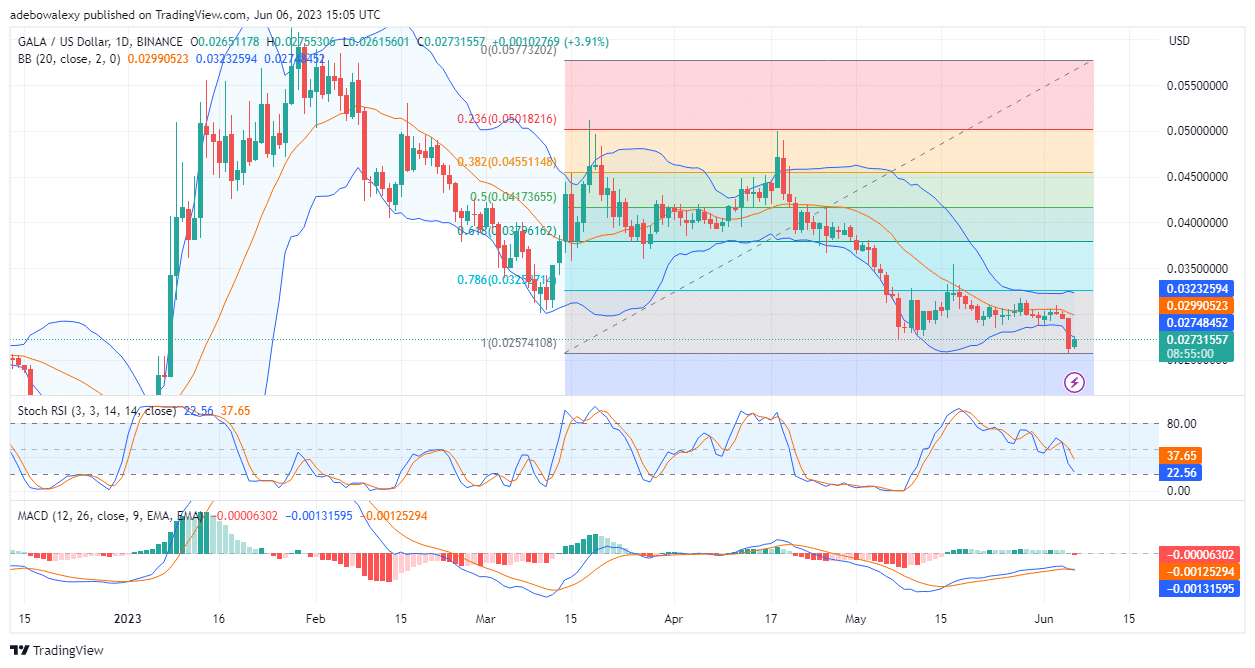
GALA/USD May Fall to Towards Lower Support Levels
The GALA/USD Price action seems to have been trending downward since the 21st of April. Ever since then, price action has been retracing lower support levels during the last trading session. At this point, price action tested the Fibonacci Retracement level of 100 as a support, and then an upside rebound resulted in the ongoing session. This suggests that price action may have reached a strong support level, from which it may correct in the upward direction. However, trading indicators seem to suggest a contrary opinion. The lines of the Relative Strength Index (RSI) have continued to descend into the oversold region. Meanwhile, a tiny red bar has just appeared below the equilibrium level to indicate that downward momentum may still be developing in this market.
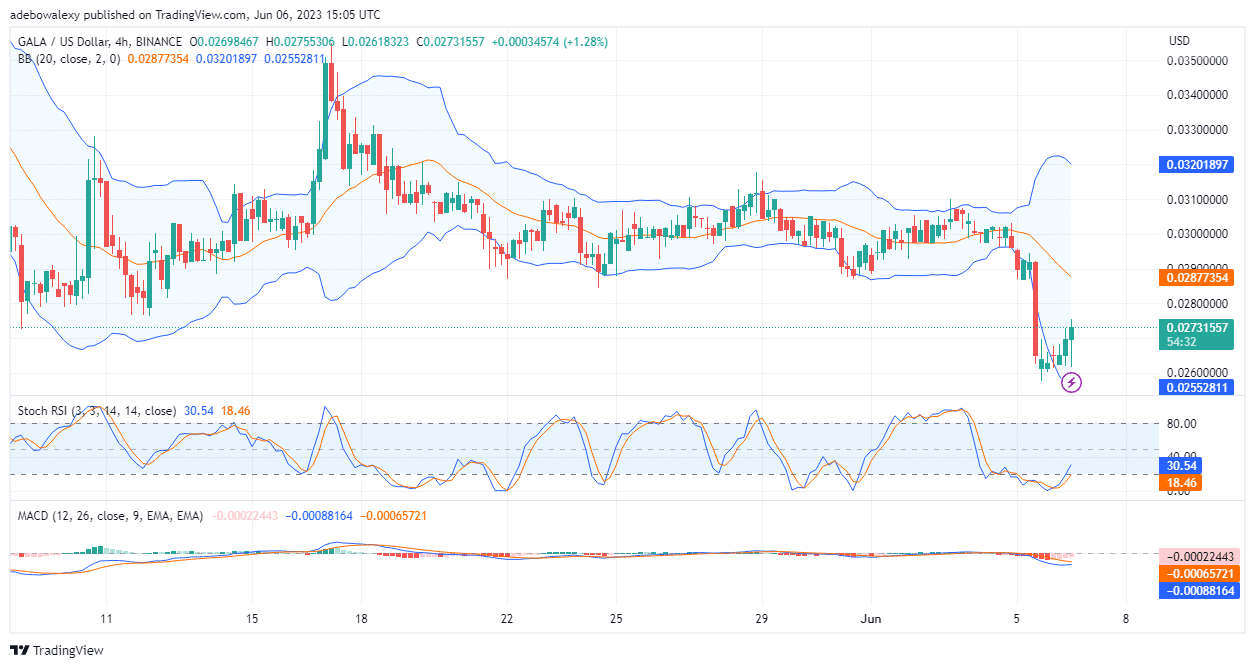
GALA/USD Shows Potential for Extending Upside Gains
The GALA/USD 4-hour market further reveals that buyers have been recording minimal profits in this market. For about six sessions here, price action has been correcting upwards towards the $0.02800 price mark. In addition, trading indicators are foretelling that prices may keep rising as bullish momentum increases. The RSI curves are now trending upwards, while the MACD indicator lines are also closer to each other at this point. In addition, the MACD is revealing that bears are losing strength and may give way for more bullish traders to take prices higher. Therefore, it seems fair enough to expect a retracement of the $0.02800 mark.
- Broker
- Min Deposit
- Score
- Visit Broker

- Award-winning Cryptocurrency trading platform
- $100 minimum deposit,
- FCA & Cysec regulated

- 20% welcome bonus of upto $10,000
- Minimum deposit $100
- Verify your account before the bonus is credited
- Fund Moneta Markets account with a minimum of $250
- Opt in using the form to claim your 50% deposit bonus
Learn to Trade
Never Miss A Trade Again

Signal Notification
Real-time signal notifications whenever a signal is opened, closes or Updated

Get Alerts
Immediate alerts to your email and mobile phone.

Entry Price Levels
Entry price level for every signal Just choose one of our Top Brokers in the list above to get all this free.