Price Analysis – January 14
Should the bears maintain their momentum to break down the support level of $2.4, then, the price may test the $2.1. In case the bulls defend the support level of $2.4, the resistance level of $3.0, $3.3 and $3.7 may be the target. The bullish trend may continue.
Key Levels:
Resistance levels: $3.0, $3.3, $3.7
Support levels: $2.7, $2.4, $2.1
EOS/USD Long-term Trend: Bearish
EOSUSD is bearish in the long-term outlook. The coin was under the strong bullish momentum last week. The bullish momentum pushed the coin to reach the resistance level of $3.7 after breaking up the $3.3 price level. The bulls’ pressure could not withstand the opposition built by the bears at resistance level of $3.7. The strong bearish candle emerges that pushed the price back below $3.0 price level. The support level of $2.4 was tested and currently, the price is pulling back.
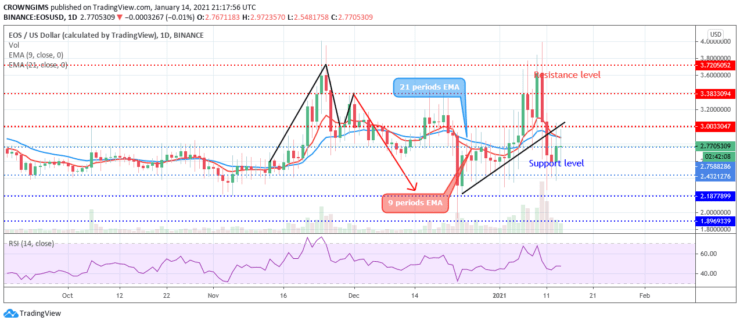
At the moment, the price is carrying out retracement towards the level of $3.0. The price is trading below the 9 periods EMA and 21 periods EMA as an indication of the bearish trend. Should the bears maintain their momentum to break down the support level of $2.4, then, the price may test the $2.1. In case the bulls defend the support level of $2.4, the resistance level of $3.0, $3.3 and $3.7 may be the target. The bullish trend may continue. Meanwhile, the relative strength index period 14 is bending up above 40 levels which indicate a buy signal.
EOS/USD Price Medium-term Trend: Bullish
On the 4 – hour chart, the buyers are gradually taken over the EOS market. The coin bottomed at the support level of $2.4 on January 11. A morning star candle pattern formed; this is a bullish reversal candle pattern. The bulls gradually increase their momentum and the price is trying to penetrate the resistance level of $2.7.
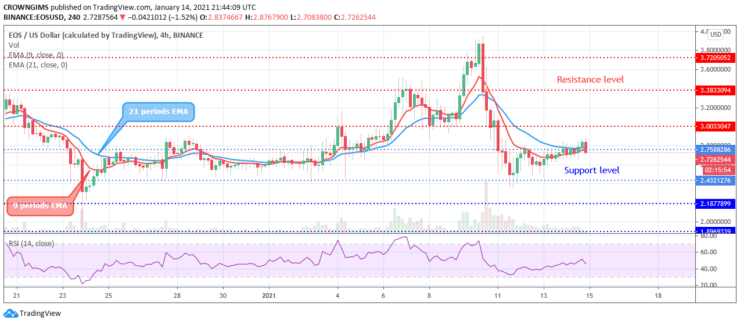
The price is struggling to trade above the 9 periods EMA and the 21 periods EMA. The relative strength index is bending down at 50 levels to indicate a sell signal which may be a pullback.
- Broker
- Min Deposit
- Score
- Visit Broker

- Award-winning Cryptocurrency trading platform
- $100 minimum deposit,
- FCA & Cysec regulated

- 20% welcome bonus of upto $10,000
- Minimum deposit $100
- Verify your account before the bonus is credited
- Fund Moneta Markets account with a minimum of $250
- Opt in using the form to claim your 50% deposit bonus
Learn to Trade
Never Miss A Trade Again

Signal Notification
Real-time signal notifications whenever a signal is opened, closes or Updated

Get Alerts
Immediate alerts to your email and mobile phone.

Entry Price Levels
Entry price level for every signal Just choose one of our Top Brokers in the list above to get all this free.