Don’t invest unless you’re prepared to lose all the money you invest. This is a high-risk investment and you are unlikely to be protected if something goes wrong. Take 2 minutes to learn more
Looking at the price chart for D2T, one could see that price movement is gathering profits toward a key price level at $0.009713. Should price action reaches this mark, bulls will have a fighting chance to retrace even higher price levels.
Dash 2 Trade: June 7, 2023
Dash 2 Trade Value: $0.009600
D2T Trade Market Cap: $3,497,510
D2T Trade Block Flowing: 299 million
Dash 2 Trade Total Supply: 1 billion
D2T ranking on CoinMarketCap: #3325
Major Price Levels:
Resistance: $0.009600, $0.009800, and $0.0100
Support: $0.009580, $0.009550, and $0.009520
 .009713 mark" width="1255" height="668" data-lazy-src="https://learn2.trade/wp-content/uploads/2023/06/D2TUSDT_2023-06-06_08-11-11.png"/>
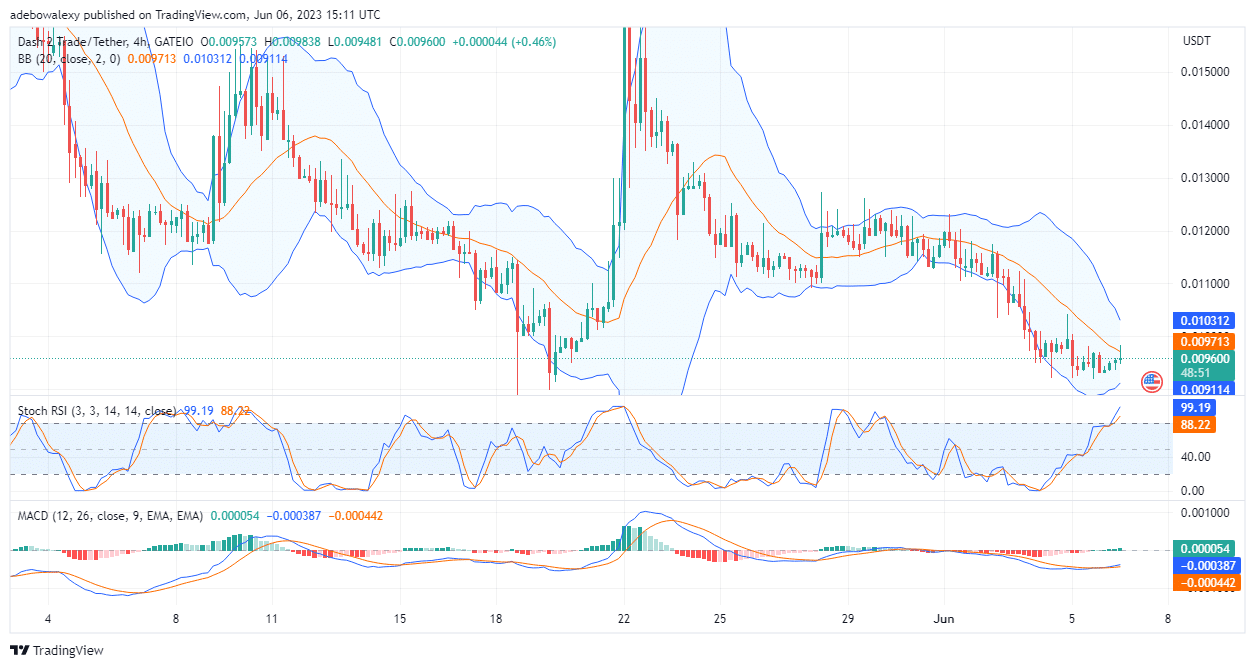
D2T Is Approaching a Notable Price Level
On the D2T 4-hour market, price action is gradually retracing the mid-limit of the Bollinger Bands indicator. The wick of the last price candlestick can be seen surpassing the mentioned part of the indicator. Consequently, this displays the readiness of price action to surpass this level. Concurrently, the Relative Strength Index (RSI) indicator lines keep rising upwards to indicate that buyers are still going long. Also, green histogram bars have started appearing above the equilibrium level of the Moving Average Convergence Divergence (MACD) indicator, and this aligns with the signs on the RSI to show that upside forces are active in this market.
.009713 mark" width="1255" height="668" data-lazy-src="https://learn2.trade/wp-content/uploads/2023/06/TAMAUSD_2023-06-06_13-52-20.png"/>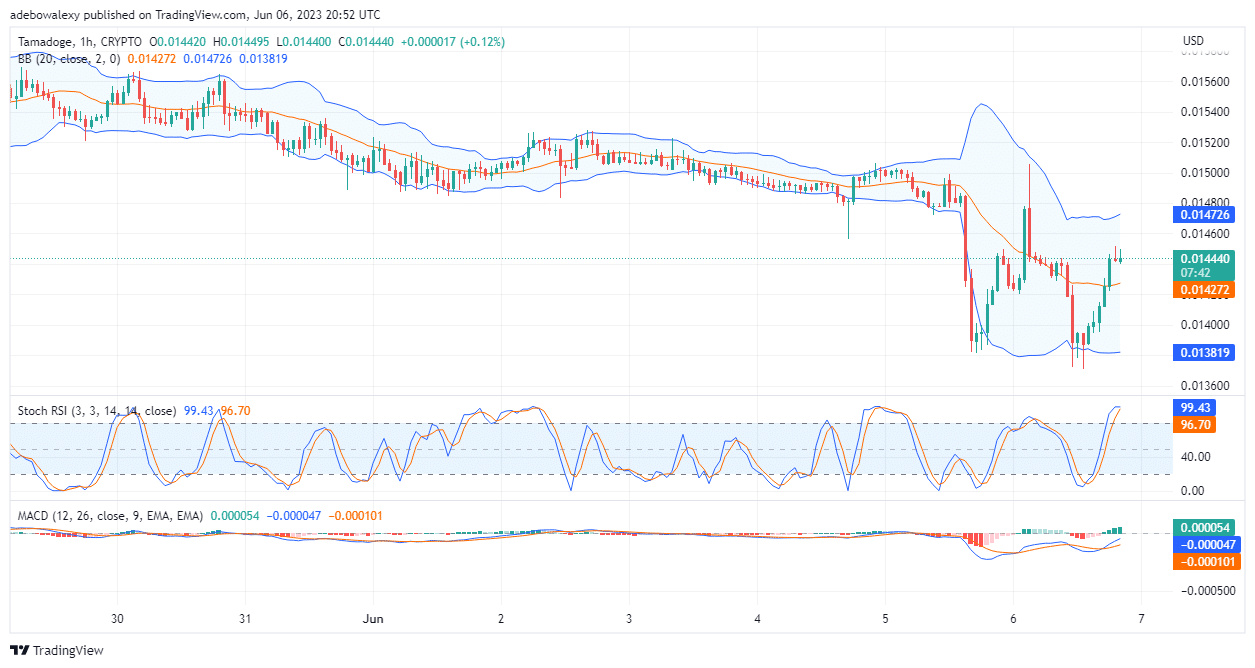
Dash 2 Trade Price Action Clings to Its Upside Target
In the hourly D2T market, one can see that price action has surpassed the middle limit of the Bollinger Bands indicator. Also, the last price candle is behaving as if it is retracting off this part of the indicator. Consequently, this suggests that price action may have obtained solid support off of which further upside retracement may occur. Furthermore, the leading line of the MACD indicator continues to rise upwards above the equilibrium level, even when its bars are pale green. Traders can keep their hopes up for a retracement toward the $0.009900 price mark. In additional details, traders should maintain a level head during this market storm that was created by the SEC.
Lets keep an open mind during the SEC’s FUD storms of ever depreciating significance. Tell us what you think below! pic.twitter.com/4I7iNWPAeb
— Dash 2 Trade (@dash2_trade) June 6, 2023
Would you like to invest in a coin that has the potential to give you huge profits? Then you may want to give Dash 2 Trade (D2T) a trial. Buy D2T now!
- Broker
- Min Deposit
- Score
- Visit Broker

- Award-winning Cryptocurrency trading platform
- $100 minimum deposit,
- FCA & Cysec regulated

- 20% welcome bonus of upto $10,000
- Minimum deposit $100
- Verify your account before the bonus is credited
- Fund Moneta Markets account with a minimum of $250
- Opt in using the form to claim your 50% deposit bonus
Learn to Trade
Never Miss A Trade Again

Signal Notification
Real-time signal notifications whenever a signal is opened, closes or Updated

Get Alerts
Immediate alerts to your email and mobile phone.

Entry Price Levels
Entry price level for every signal Just choose one of our Top Brokers in the list above to get all this free.