S&P 500 Price Analysis – August 02
Below the price at the moment are support levels at $4087, $4019, and $3927. S&P 500 may penetrate resistance level at $4169 upside, and further increase envisaged towards $4276 and $4364 levels. The relative strength index period 14 is at 64 levels with the signal lines pointing up to indicate buy signal.
Key levels:
Resistance levels: $4169, $4276, $4364
Support levels: $4087, $4019, $3927
S&P 500 Long-term trend: Bullish
S&P 500 is bullish on the daily chart. The double bottom chart pattern formed triggers the bullish trend in the S&P 500 market. Since two weeks ago, the price has been operating under the pressure of the buyers. In other words, it has been bullish. Former resistance levels of $3927 and $4019 have turn to support. The bulls’ pressure is increasing and the price will increase accordingly.
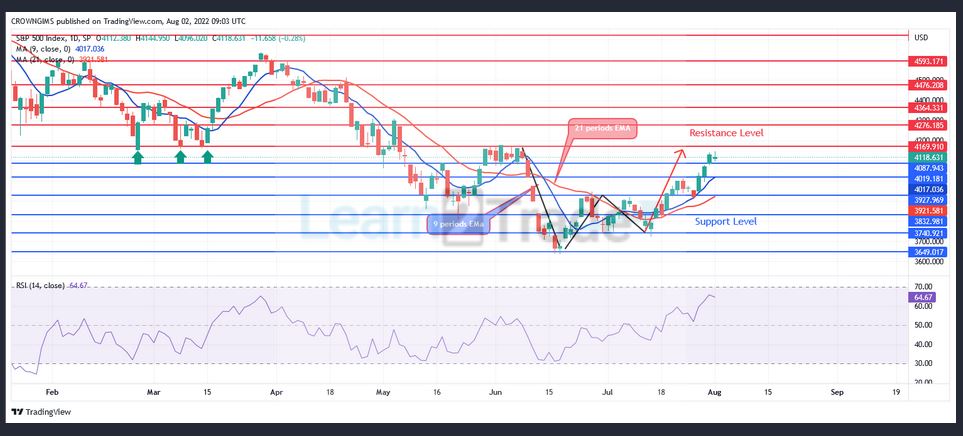
S&P 500 is trading above the 9 periods EMA and the 21 periods EMA which connote an increase in the buyers’ momentum. Below the price at the moment are support levels at $4087, $4019, and $3927. S&P 500 may penetrate resistance level at $4169 upside, and further increase envisaged towards $4276 and $4364 levels. The relative strength index period 14 is at 64 levels with the signal lines pointing up to indicate buy signal.
S&P 500 Medium-term Trend: Bullish
On the 4-hour chart outlook, S&P 500 is on the bullish movement. When the support level of $3649 was tested and bears could not penetrate the level downside. The bullish chart pattern called Double bottom formed in 4 hour chart. The price broke up the former resistance level of $4087 level. The resistance level of $4169 is exposed.
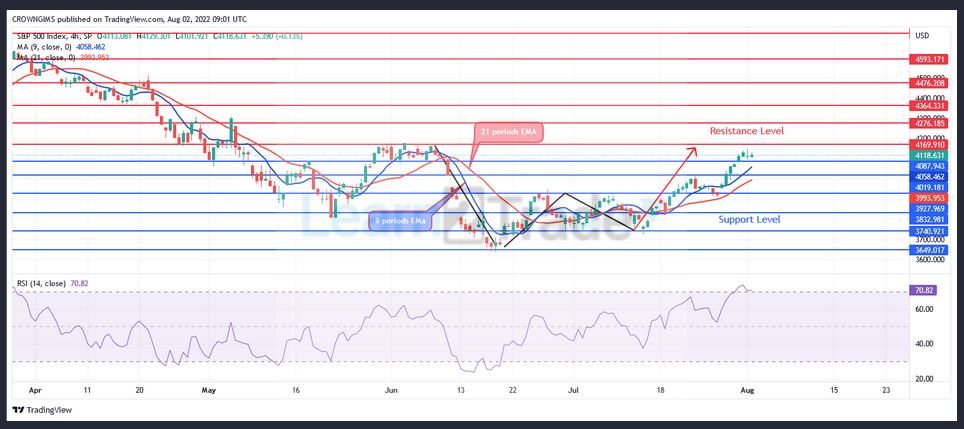
The price is trading above the 9 periods EMA and 21 periods EMA as an indication of bullish movement. The relative strength index period 14 is at 70 levels displaying bullish signal.
You can purchase crypto coins here: Buy LBlock
- Broker
- Min Deposit
- Score
- Visit Broker

- Award-winning Cryptocurrency trading platform
- $100 minimum deposit,
- FCA & Cysec regulated

- 20% welcome bonus of upto $10,000
- Minimum deposit $100
- Verify your account before the bonus is credited
- Fund Moneta Markets account with a minimum of $250
- Opt in using the form to claim your 50% deposit bonus
Learn to Trade
Never Miss A Trade Again

Signal Notification
Real-time signal notifications whenever a signal is opened, closes or Updated

Get Alerts
Immediate alerts to your email and mobile phone.

Entry Price Levels
Entry price level for every signal Just choose one of our Top Brokers in the list above to get all this free.