Should Bears are able to push the price to support level of $1.11, then, support level of $1.10 and $1.09 may be reached. On the other hand, in case the just mentioned level holds, the price may continue its bullish trend towards $1.13, $1.14 and $1.16 levels.
EUR/USD Market
Key Levels:
Resistance levels: $1.13, $1.14, $1.16
Support levels: $1.11, $1.10, $1.09
EURUSD Long-term Trend: Bearish
On the long term outlook, EURUSD is bearish. EURUSD currency pair has been on the ranging trend for more than 2 weeks. The price had a bearish partial breakout on January 27. The price reached the support level of $1.11. The Bullish momentum became strong and the level could not be broken downside by the bears. On the daily chart, a strong bullish candle was produced which penetrated the price level of $1.13 upside and the price tested $1.14 level. The price is currently pulling back towards the $1.11 support level.
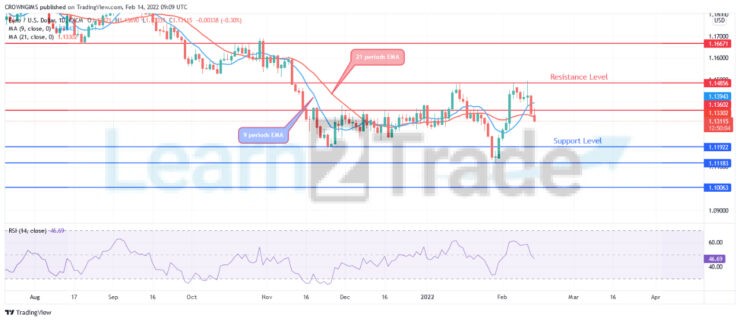
EURUSD is penetrating the two EMA downside, the price is trading below the 21 periods EMA and 9 periods EMA heading towards the previous low of $1.11. Should Bears are able to push the price to support level of $1.11, then, support level of $1.10 and $1.09 may be reached. On the other hand, in case the just mentioned level holds, the price may continue its bullish trend towards $1.13, $1.14 and $1.16 levels. Also, the Relative Strength index period 14 is at 46 levels pointing down to indicate further price reduction.
EURUSD medium-term Trend: Bearish
EURUSD is bearish on the medium-term outlook. The price action on the 4-hour chart has formed Double Top chart pattern. The neckline is broken and the price declining, already broke down the former resistance level of $1.13 heading towards the support level of $1.11.
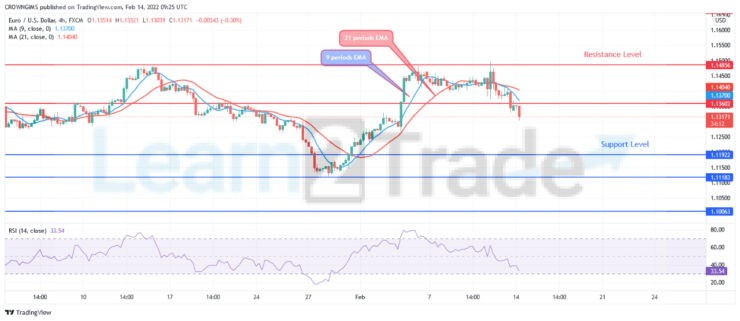
The Relative Strength Index period 14 is at 33 levels with the signal lines pointing down to indicate a sell signal and further reduction in price.
- Broker
- Min Deposit
- Score
- Visit Broker

- Award-winning Cryptocurrency trading platform
- $100 minimum deposit,
- FCA & Cysec regulated

- 20% welcome bonus of upto $10,000
- Minimum deposit $100
- Verify your account before the bonus is credited
- Fund Moneta Markets account with a minimum of $250
- Opt in using the form to claim your 50% deposit bonus
Learn to Trade
Never Miss A Trade Again

Signal Notification
Real-time signal notifications whenever a signal is opened, closes or Updated

Get Alerts
Immediate alerts to your email and mobile phone.

Entry Price Levels
Entry price level for every signal Just choose one of our Top Brokers in the list above to get all this free.