Bitcoin sits at record highs right now. If you bought at any point before today, you’re sitting pretty. But here’s where most people get it wrong—they spend their time glued to price charts when the real action happens somewhere else entirely.
Smart money doesn’t just watch price movements. They dig deeper into blockchain data that reveals what’s actually happening behind the scenes. This approach, called on-chain analysis, exposes the difference between genuine market strength and hollow rallies that collapse without warning.
Think of Bitcoin’s blockchain as a giant ledger that never lies. Every transaction, every wallet movement, and every exchange deposit gets recorded permanently.
While headlines scream about price swings and social media influences spread hype, the blockchain quietly tells the truth about who’s buying, selling, and holding for the long haul.
The Network Activity Revolution in Bitcoin Analysis
Traditional market cycles used to follow a simple pattern. Early adopters and large holders would accumulate coins during quiet periods.
Retail investors would pile in during price surges. Then the early adopters would sell, leaving retail investors holding worthless bags. This cycle repeated predictably for years.
Something fundamental changed this time around. The market structure looks completely different now because institutional players entered the game through exchange-traded funds (ETFs).
These funds didn’t exist during previous cycles, but they’ve absorbed over 60,000 Bitcoin in just the past month alone.
When ETF providers create new shares to meet investor demand, they must purchase actual Bitcoin to back those shares.
This creates measurable on-chain activity that shows up in network metrics. Every ETF purchase moves real coins from one wallet to another, creating a paper trail that sophisticated analysts can track.
The most revealing metric is active address count. This measures how many unique wallets conduct transactions during specific time periods.
When active addresses climb alongside price increases, it signals that real users—not just speculators—are driving demand. Healthy bull markets show steady growth in both metrics together.
Exchange netflows provide another crucial signal. When more Bitcoin flows out of exchanges than flows in, it typically means investors are moving coins into cold storage for long-term holding. Just like it’s doing currently:
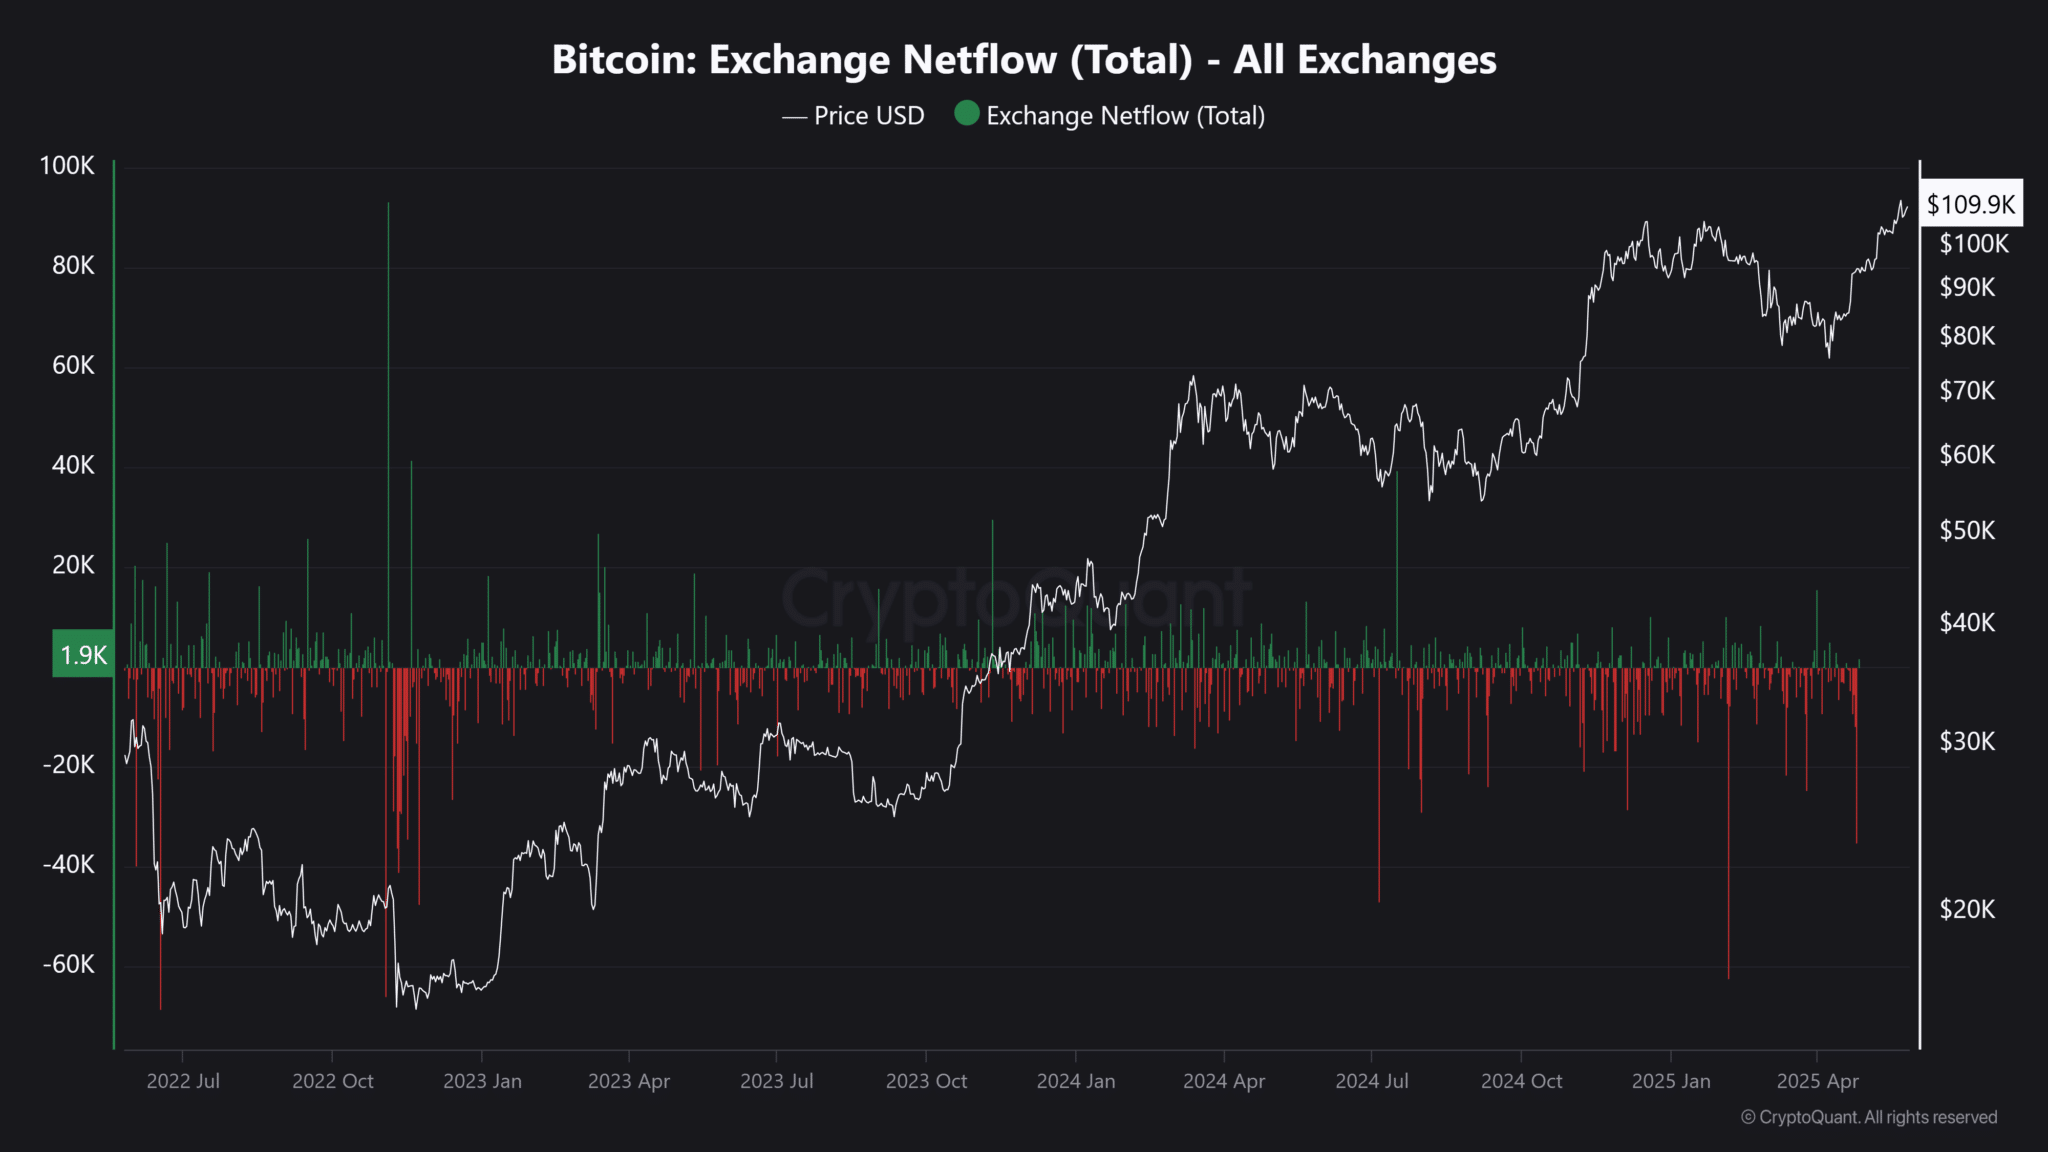
These movements reduce the supply available for immediate selling, which creates upward pressure on prices.
Current data shows Bitcoin leaving exchanges at accelerated rates while active addresses stabilize after months of decline. This combination suggests accumulation by serious investors rather than speculative trading by short-term players.
Long-Term Holder Behavior Reveals Market Strength
Professional traders focus heavily on long-term holder metrics. These measurements track wallets that haven’t moved their Bitcoin for at least 155 days. When this supply increases during price rallies, it indicates strong conviction among experienced investors who expect further growth.
Recent blockchain data shows long-term holders continuing to accumulate even as prices reach new highs. This behavior contrasts sharply with typical market tops, where experienced investors usually distribute their holdings to incoming retail buyers.
The Market Value to Realized Value (MVRV) ratio offers additional insight into market positioning. This metric compares current Bitcoin prices to the average cost basis of all coins in circulation.
Values above 3.0 historically signal overheated conditions, while readings between 1.5 and 2.5 suggest healthy growth potential.
Bitcoin’s current MVRV ratio sits at 2.1, indicating room for additional price appreciation before reaching historically dangerous levels. This measurement helps distinguish between sustainable rallies and speculative bubbles that end in sharp corrections.
ETF inflow data provides real-time insight into institutional demand patterns. Unlike individual investor behavior, which can be emotional and unpredictable, institutional flows tend to follow longer-term allocation strategies. Here’s a look at the current standings of BTC ETF inflows:
Consistent positive inflows suggest professional money managers view Bitcoin as an attractive asset class for their portfolios.
The combination of declining exchange balances, growing long-term holder supply, and steady institutional inflows creates a powerful foundation for continued price strength.
These metrics matter more than daily price movements because they reflect genuine supply and demand dynamics rather than speculative trading activity.
Understanding on-chain metrics helps investors separate signal from noise in Bitcoin markets. While price charts show what happened, blockchain data reveals why it happened and what might come next.
This approach provides a significant advantage over traders who rely solely on technical analysis or market sentiment indicators.
Interested In Trading The Market With A Trustworthy Partner? Try Eightcap Today.
- Broker
- Min Deposit
- Score
- Visit Broker

- Award-winning Cryptocurrency trading platform
- $100 minimum deposit,
- FCA & Cysec regulated

- 20% welcome bonus of upto $10,000
- Minimum deposit $100
- Verify your account before the bonus is credited
- Fund Moneta Markets account with a minimum of $250
- Opt in using the form to claim your 50% deposit bonus
Learn to Trade
Never Miss A Trade Again

Signal Notification
Real-time signal notifications whenever a signal is opened, closes or Updated

Get Alerts
Immediate alerts to your email and mobile phone.

Entry Price Levels
Entry price level for every signal Just choose one of our Top Brokers in the list above to get all this free.