

NAS100 Analysis – May 25
NAS100 is undergoing a clear pullback within a broader bullish continuation structure. The index has dipped below its 9-day Simple Moving Average, currently near $21,240, indicating short-term selling pressure. However, the RSI remains comfortably above 50 at 58.7, after recently reaching 64.5, suggesting that underlying bullish momentum remains intact and the retracement may merely represent a temporary pause before further gains.
NAS100 Key Levels
Resistance Levels: $21,400, $22,140, $23,000
Support Levels: $20,360, $18,320, $17,250
NAS100 Long-Term Trend: Bullish
Recent upward momentum stalled at the $21,400–$21,370 supply zone, an area marked by an existing imbalance. The ongoing correction is likely to move toward the critical support zone near $20,360. This level aligns with a bullish breaker block and a previous market structure shift, making it a highly significant confluence zone. If buyers step in to defend this area, it would reaffirm the market’s intention to continue its bullish trajectory.
Additionally, the recent rally left behind a fair value gap that is now being revisited, which enhances the likelihood of a rebound if buyers re-engage the market with conviction. Looking ahead, holding the $20,360 support level is essential for validating the bullish continuation outlook. If sustained, the next resistance levels to watch are $21,400, followed by $22,140 and eventually $23,000. On the other hand, a breakdown below $20,360 could lead to a deeper pullback toward $19,270, with potential further downside extending to $18,320. In this context, forex signals may offer timely insights into market entries and exits.
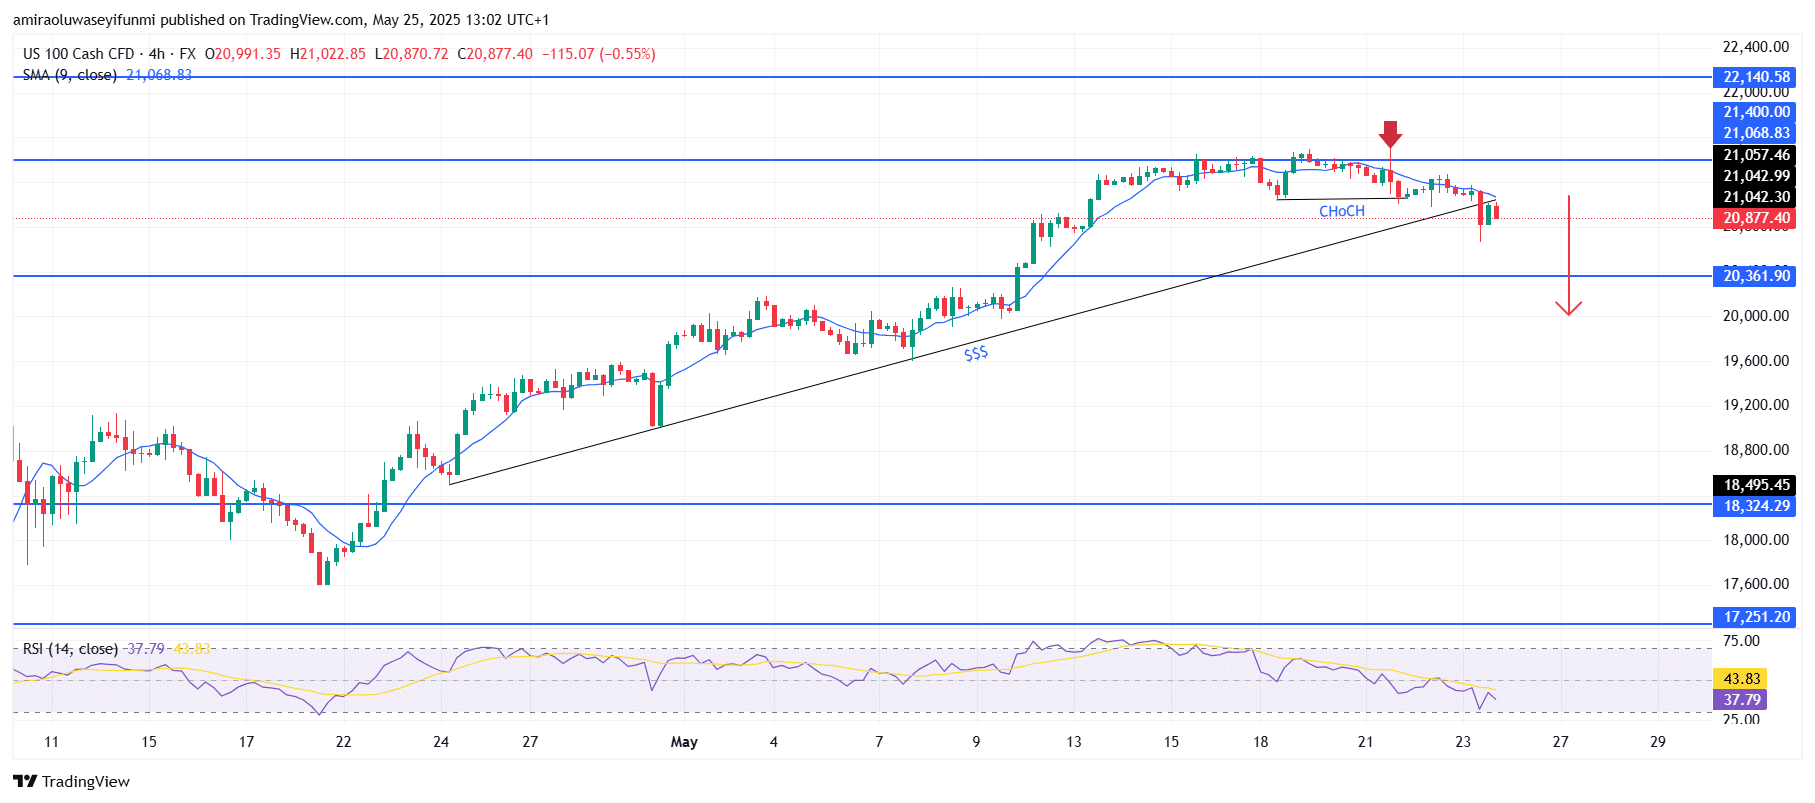

NAS100 Short-Term Trend: Bearish
Make money without lifting your fingers: Start using a world-class auto trading solution
How To Buy Lucky Block
Note: Learn2.trade is not a financial advisor. Do your research before investing your funds in any financial asset, product, or event. We are not responsible for your investment results.


