NAS100 Analysis – May 18
NAS100 continues to display strong bullish momentum, with an upside continuation remaining likely. From a technical perspective, NAS100 maintains a robust bullish trajectory, supported by key momentum indicators. The 9-day Simple Moving Average (SMA), currently positioned around $20,660, is sloping upward and remains well below current price levels, reinforcing short-term bullish sentiment. The Relative Strength Index (RSI) is hovering near 70.68, indicating strong buying pressure and sustained momentum. While it approaches overbought levels, the RSI suggests institutional confidence rather than imminent reversal, especially within a trending market environment.
NAS100 Key Levels
Resistance Levels: $21,400, $22,140, $23,000
Support Levels: $20,360, $18,320, $17,250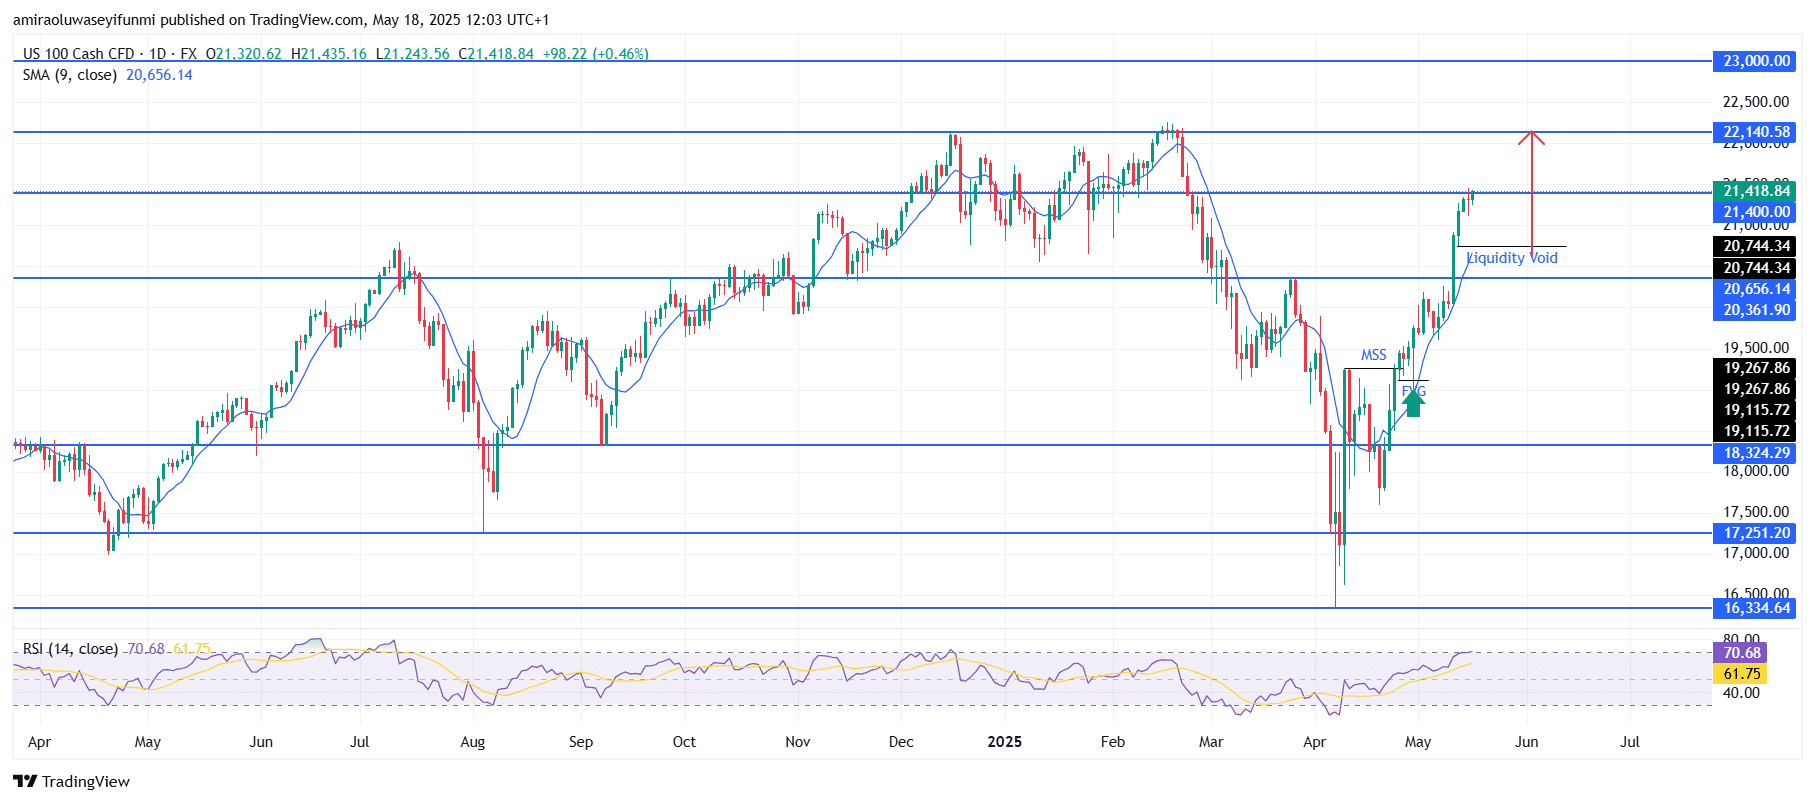
NAS100 Long-Term Trend: Bullish
The price action reinforces this strength, having decisively broken above previous resistance levels and surpassing the $21,400 mark with conviction. The chart reveals a bullish market structure shift (MSS), followed by a fair value gap (FVG) fill that initiated a liquidity sweep, pushing prices higher. The breach of the liquidity void confirms a restoration of market efficiency, indicating that prior sell-side imbalances have been absorbed. With a sequence of higher lows and assertive bullish candles, the market reflects signs of institutional order flow aligned with accumulation, a common trait seen in forex signals.
Looking forward, the short-term outlook favors continued movement toward the $22,140 resistance level, with a medium-term target set at $23,000. A minor pullback toward the $21,400 or $20,740 zones may emerge, providing a potential re-entry point for long positions. As long as the price structure holds above $20,360, the primary scenario remains bullish continuation. The strength of the recent breakout, along with the fill of the inefficiency zone, supports a strong likelihood of further upside in the coming weeks.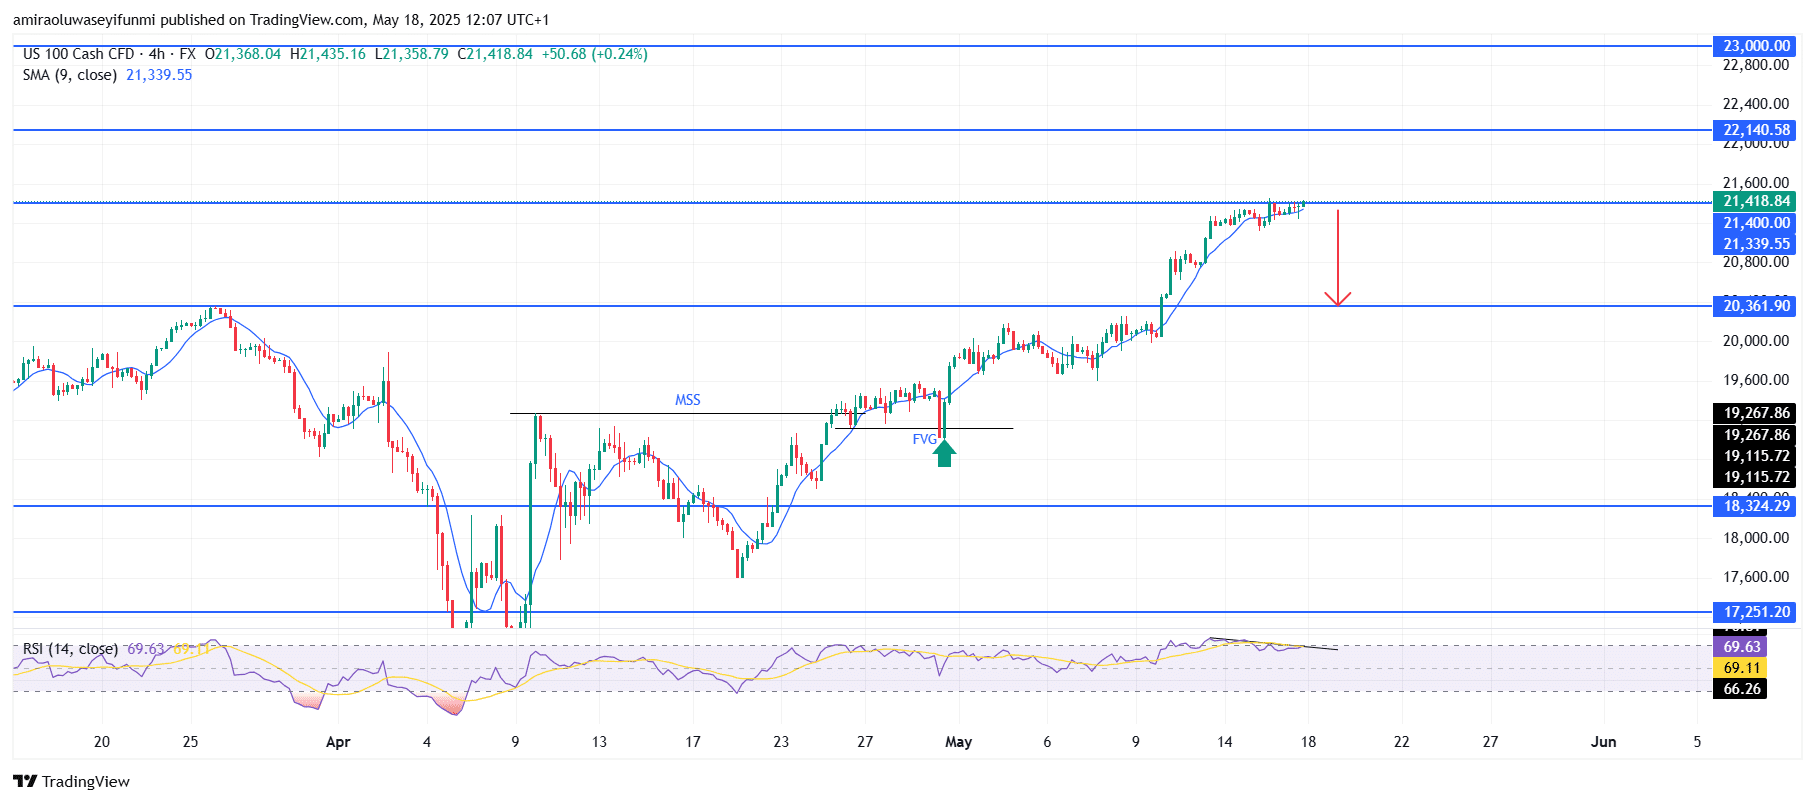
NAS100 Short-Term Trend: Bullish
NAS100 is currently encountering resistance around $21,420 and showing signs of near-term exhaustion. The RSI, nearing 70, is forming a slight bearish divergence, suggesting a potential short-term pullback. Price may retreat toward the $20,360 support zone if selling pressure increases.
Make money without lifting your fingers: Start using a world-class auto trading solution
How To Buy Lucky Block – Guide, Tips & Insights | Learn 2 Trade
Note: Learn2.trade is not a financial advisor. Do your research before investing your funds in any financial asset, product, or event. We are not responsible for your investment results.
- Broker
- Min Deposit
- Score
- Visit Broker

- Award-winning Cryptocurrency trading platform
- $100 minimum deposit,
- FCA & Cysec regulated

- 20% welcome bonus of upto $10,000
- Minimum deposit $100
- Verify your account before the bonus is credited
- Fund Moneta Markets account with a minimum of $250
- Opt in using the form to claim your 50% deposit bonus
Learn to Trade
Never Miss A Trade Again

Signal Notification
Real-time signal notifications whenever a signal is opened, closes or Updated

Get Alerts
Immediate alerts to your email and mobile phone.

Entry Price Levels
Entry price level for every signal Just choose one of our Top Brokers in the list above to get all this free.