

Ethereum (ETH) Current Statistics
The current price: $2,401.90
Market Capitalization: $289,959,282,265.37
Trading Volume: $32,144,115,081.2
Major supply zones: $3,500, $4,000, $4,500
Major demand zones: $2,500, $2,000, $1,500
Ethereum (ETH) Price Analysis May 19, 2025
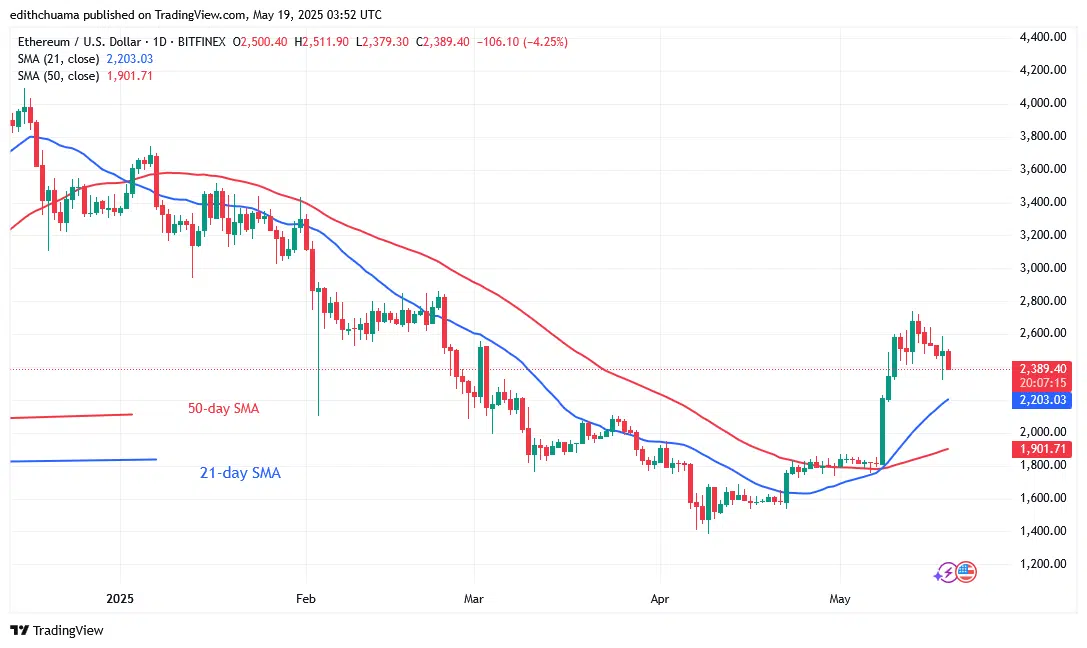
Ethereum (ETH) falls steadily above the pivotal support of $2,400. Buyers were unable to maintain the positive trend above $2,800. However, the altcoin will reach a high of $3,000 if it breaks above the $2,800 high. Ether is currently trading above the $2,400 support after retracing. If the bears break through the $2,400 support, the largest altcoin could drop to the low above the 21-day SMA. Ether will restart its upward trend if the price retraces and holds above the 21-day SMA support. Ether has already fallen back to $2,389 as of this writing.
ETH Technical Indicators Reading
The price bars have retraced and are getting closer to the 21-day SMA support after the last rejection. On the downside, Ether will continue to drop if the 21-day SMA support is violated. The biggest altcoin will continue to rise as long as the 21-day SMA support remains. The upward-sloping moving average lines show an uptrend.
Conclusion
Ethereum hovers above the pivotal support of $2,400. Incidentally, it is above the psychological price threshold of $2,000 on the daily chart. Ether’s price remains above the $2,300 support level. On the 4-hour chart, Ether moves sideways, above the $2,300 support but below the $2,700 resistance. The price is now stabilizing above the current support of $2,300. The crypto signal is positive if the current support holds.

Make money without lifting your fingers: Start using a world-class auto trading solution.
Note: Learn2.Trade is not a financial advisor. Do your research before investing your funds in any financial asset or presented product, or event. We are not responsible for your results.


