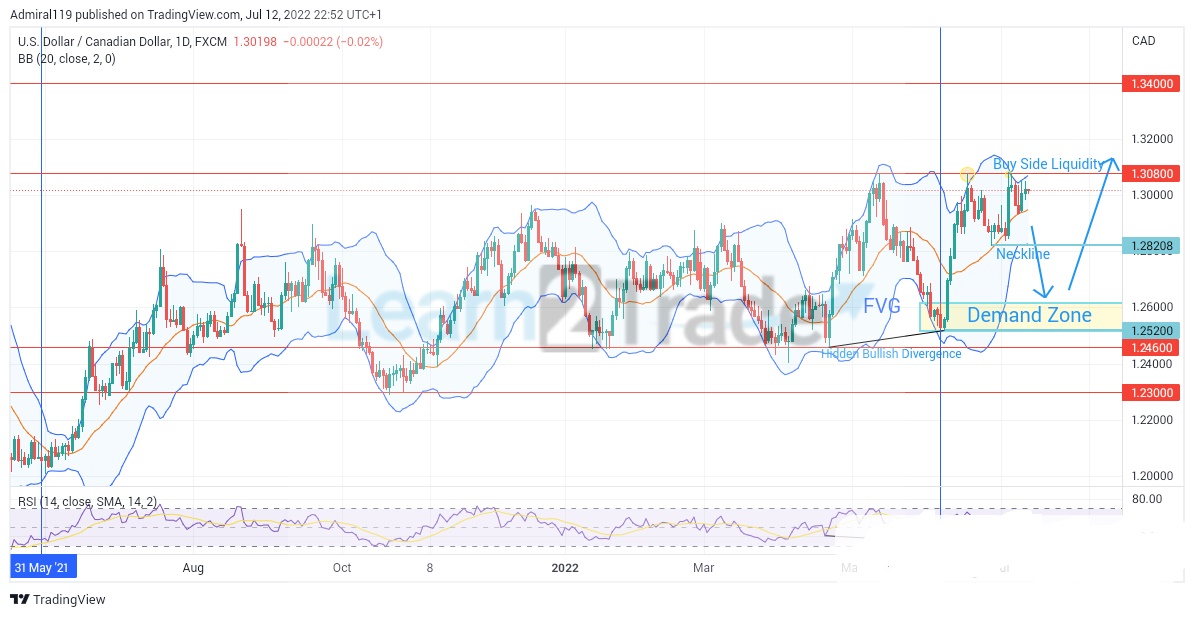
USDCAD resumes the market trend in an upward direction after a long period of indecision between two significant levels. The USDCAD market was in a bearish trend until May 31, 2021. The market is currently trading between two major levels, 1.3080 and 1.2460, as higher highs and lower lows are being formed.
USDCAD Major Levels
Resistance levels: 1.3400, 1.3080 Support levels: 1.2460, 1.2300
USDCAD Long-Term Trend: Bullish
USDCAD has been ranging and struggling to break out of its six-month low and high. The market keeps ranging within the levels and Bollinger Bands (BB). The bulls successfully pumped the market until it reached a major resistance level at 1.3080, at which point it crashed down to form a higher swing low. Because of a large volume of buy limit orders placed around this higher swing low, the price rose quickly back to the resistance level at 1.3080, leaving a trail of buy orders and a fair value gap (FVG) that must be filled later for the market to resume its upward trend.
The Relative Strength Index (RSI), which formed lower lows as prices formed higher lows in the market, confirmed a hidden bullish divergence on June 7, 2022. After the higher low was formed on the price chart, the price reached the major resistance level at 1.3080 for the second time in a year, forming double tops in the process. Following the formation of the double tops, buy-side liquidity (BSL) exits above the tops, and market makers will seek the BSL to either reverse or continue the market trend in the future.
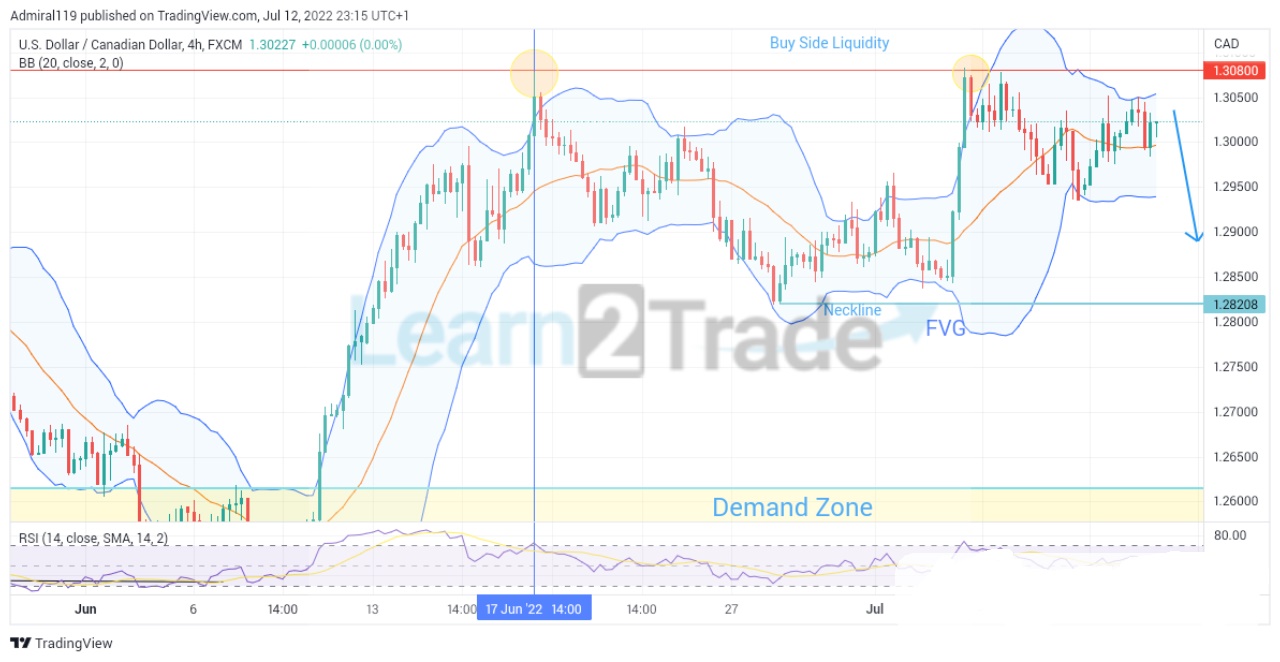
USDCAD Short-Term Trend: Bearish
On the four-hour chart, an evening star candlestick could be seen after the price reached the upper band of the Bollinger Bands, indicating that the market would continue to fall for some time. Once the neckline of the double top is broken, the market may continue to fall towards the demand zone to close the fair value gap before resuming its upward trend. Due to the hidden bullish divergence confirmed by the price’s higher lows and the Relative Strength Index’s lower lows, USDCAD is expected to resume its market trend in an upward direction. The price is unlikely to break the demand zone at 1.2520 before clearing off the liquidity above the 1.3080 level.
Note:Learn2.trade is not a financial advisor. Do your research before investing your funds in any financial asset or presented product or event. We are not responsible for your investing results.
Trade on MT4 with Leverage up to 1:500! Trade on MT4 with Leverage up to 1:500!
X
We use cookies to ensure that we give you the best experience on our website. If you continue to use this site we will assume that you are happy with it.OkPrivacy policy