USDCAD indicates a scheme for a dip in an up-trending market. Following price elevation to various key levels of importance, the market is still determined to trade lower despite the prevailing bullish strength. The market picture shows the buyers’ and sellers’ mechanisms of holding price influence. An upward momentum seems to keep the market strength above old price levels as buyers maintain the price prestige.
USDCAD Key Zones:
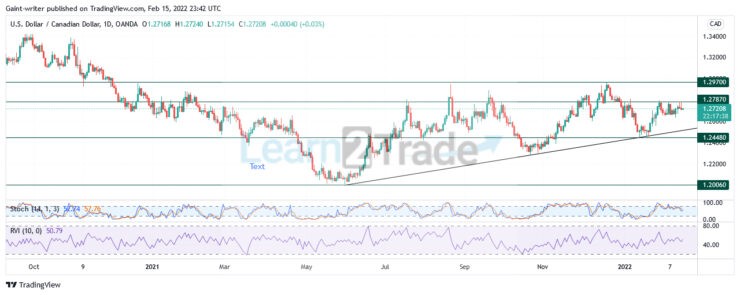
Resistance Zones: 1.29700, 1.27870 Support Zones: 1.24480, 1.20060
USDCAD Long Term Trend: Bullish
The bear merchants were the first to invest in the market direction. The sellers broke through several pending orders in the market. From October 2020 to May 2021, the bear trend emerged when the market reached the critical zone. From this level, the bulls changed the direction of price tendency. The bullish ride waved price activity forward as it progressed along the trend line channel.
The price first emerged from the 1.24480 and 1.27870 levels of influence before retesting the trend line channel. The bulls from here continue to give way to the rise in the market till the price ultimately gets to the 1.29700 significant zone. However, the market is now accumulating near the 1.27870 level before dropping. The Stochastic Oscillator indicates that though the price is in the high region, the market forces seek to cause a dip in the uptrend market.
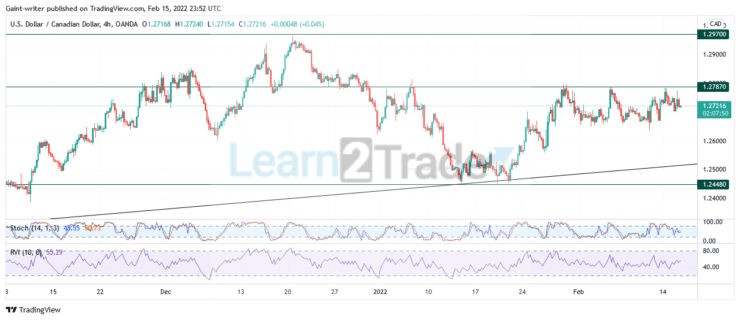
USDCAD Short Term Trend: Bearish
The 4-hour chart of the market shows the market diffusion of both buyers and sellers in the market. The Stochastic and Relative Volume Strength indicators suggest that the price will plunge from the uptrend phase back to the trendline and retest the 1.24480 level of significance before the bullish phase continues.
Note:Learn2.trade is not a financial advisor. Do your research before investing your funds in any financial asset or presented product or event. We are not responsible for your investing results.
Trade on MT4 with Leverage up to 1:500! Trade on MT4 with Leverage up to 1:500!
X
We use cookies to ensure that we give you the best experience on our website. If you continue to use this site we will assume that you are happy with it.OkPrivacy policy