EURCHF keeps retesting between the 1.0070 resistance key level and the 1.0700 support level. The market has been kept back by its bearish trend. This is due to price rejection between the two key zones. The EURCHF market has been battling to continue its bearish trend and has been retesting. Price is anticipated to gain a little bullish momentum as it maintains its accumulation level.
EURCHF Significant Zones
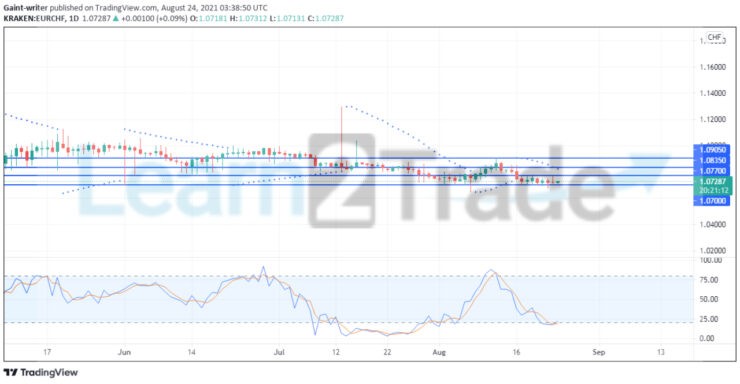
Resistance levels: 1.07700, 1.09050 Support levels: 1.07000, 1.08350
EURCHF Long Term Trend: Ranging
The market began to tumble and move in a bearish trend after a retesting of the 1.0905 resistance key level. After accumulating between the 1.08350 and 1.07700 key levels, this trend gained strength. Following that, the price breaks out in a bearish direction. There appears to be a pullback as the market begins to retest the key level of 1.0770. Several price rejections have occurred near this key level. Because of the price accumulation around this level, the EURCHF price may either gain more bullish strength or continue in its bearish direction.
However, the market has maintained a significant range between the 1.07700 resistance level and the 1.0700 support level. Price will continue to accumulate before a breakout can occur. The stochastic Oscillator on the daily chart gives a cross around the 50 level. This indicates market indecision as its ranges. This demonstrates that neither the bears nor the bulls were willing to make a decisive move lower or higher as the market continued to range, retesting key levels.
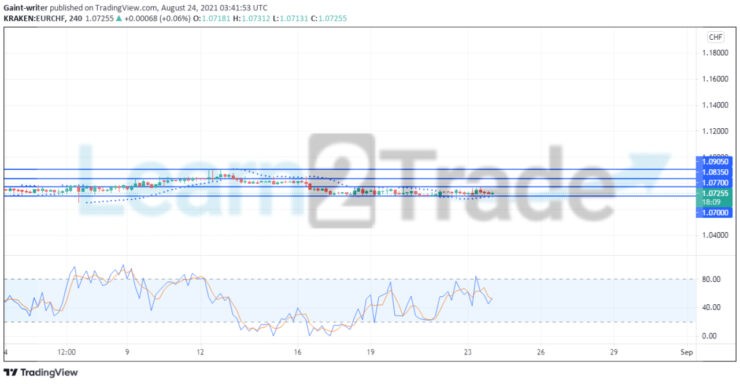
EURCHF Short Term Trend: Ranging
On the 4-hour chart, the market is still in a range and retesting key levels. As more dots are displayed on the Parabolic SAR (Stop and Reverse). This indicates a bearish continuation. The Stochastic Oscillator indicates an oversold condition, indicating that the market is likely to reverse near 1.07700. This reversal could be a retest of the key resistance level of 1.07700 or a break above it.
Note:Learn2.trade is not a financial advisor. Do your research before investing your funds in any financial asset or presented product or event. We are not responsible for your investing results.
Trade on MT4 with Leverage up to 1:500! Trade on MT4 with Leverage up to 1:500!
X
We use cookies to ensure that we give you the best experience on our website. If you continue to use this site we will assume that you are happy with it.OkPrivacy policy