Sellers’ momentum may decrease
AUDUSD Price Analysis – 01 March
In case sellers are successful in holding the $0.68 resistance level, AUDUSD may decline below the $0.66, $0.65, and $0.63 support levels. The resistance level of $0.68 may be broken higher when buyers gain more traction, and the price may then rise as a result of the upward momentum to levels of $0.70 and $0.71.
AUD/USD Market
Key levels:
Resistance levels: $0.68, $0.70, $0.71
Support levels: $0.66, $0.65, $0.63
AUDUSD Long-term Trend: Bearish
AUDUSD is on a bearish movement in the daily chart. The currency pair attempted to break over the $0.71 resistance level on February 2. On the level above, two experiments have been done. The first exchange took place on January 26. The price bounced off the important resistance level that was highlighted before; it is still in place. On February 6, a solid daily bearish candle developed and pierced the $0.70 level, which caused the price to fall under the $0.68 support level.
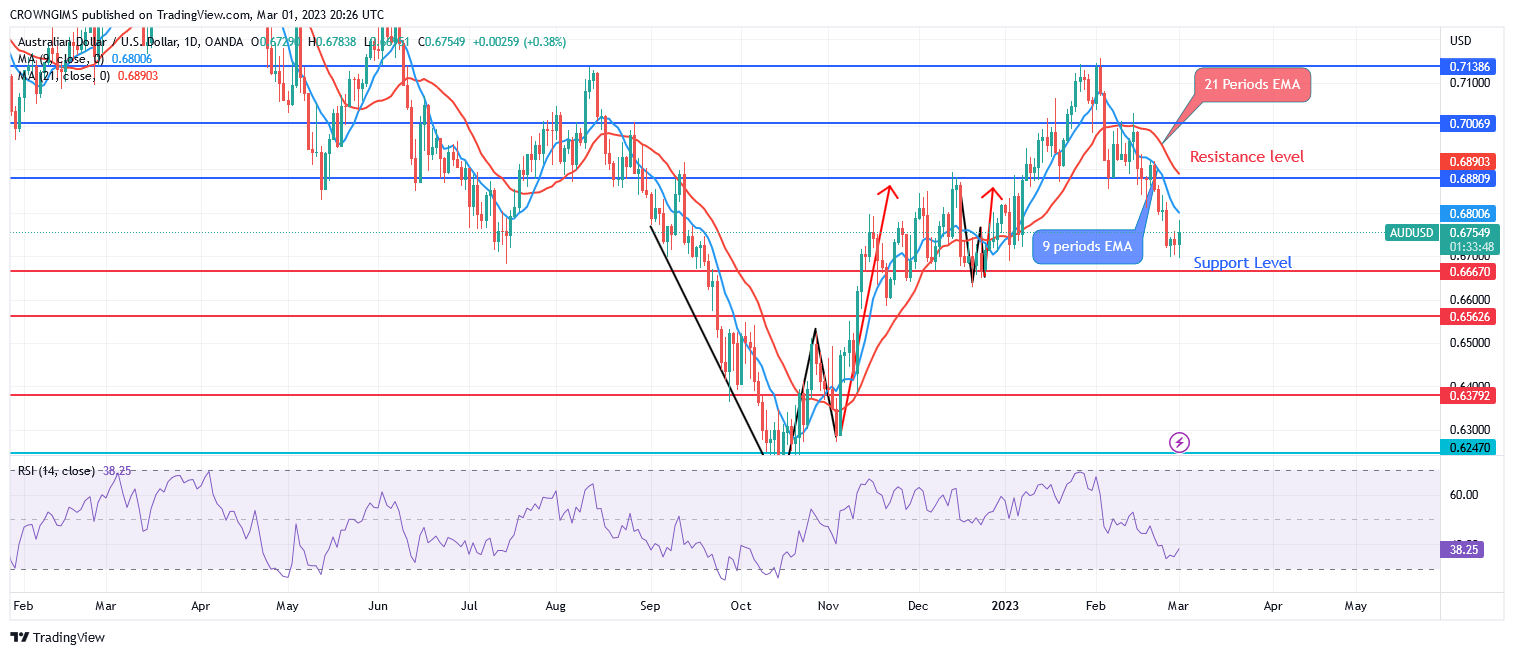
The price is edging closer to $0.66, a level of support. The currency pair had retraced last week before experiencing different high swings. The 9-period and 21-period exponential moving averages of the AUDUSD currency pair are currently trading below each other, indicating a bearish trend. In case sellers are successful in holding the $0.68 resistance level, the price may decline below the $0.66, $0.65, and $0.63 support levels. The resistance level of $0.68 may be broken higher when buyers gain more traction, and the price may then rise as a result of the upward momentum to levels of $0.70 and $0.71.
AUDUSD medium-term Trend: Bearish
AUDUSD is bearish on the 4-hour chart. The strong trend forced the price to attempt the $0.71 barrier level on January 26. It retreated and made an effort to hold the $0.70 support level. Increased buyer pressure caused the price to test the prior high at $0.71 the next day, which resulted in the formation of the double-top chart pattern. It began to fall near the $0.66 support level. The price is below $0.70 and $0.68 at the moment.
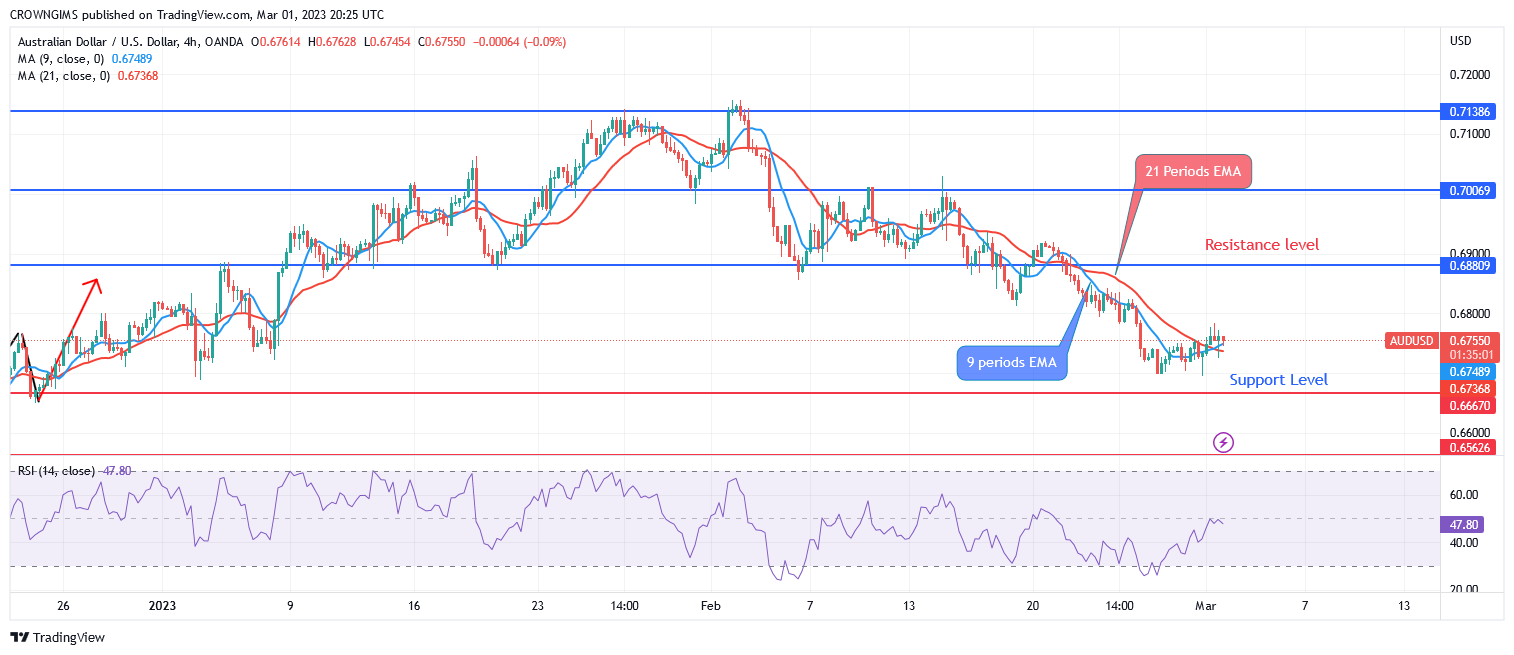
A bearish market is indicated by the fact that the AUDUSD is trading below both the 9-period and 21-period exponential moving averages. Signal lines descending and the Relative Strength Index period 14 falling to 38 levels indicate a sell signal.
You can purchase Lucky Block here. Buy LBLOCK
- Broker
- Min Deposit
- Score
- Visit Broker

- Award-winning Cryptocurrency trading platform
- $100 minimum deposit,
- FCA & Cysec regulated

- 20% welcome bonus of upto $10,000
- Minimum deposit $100
- Verify your account before the bonus is credited
- Fund Moneta Markets account with a minimum of $250
- Opt in using the form to claim your 50% deposit bonus
Learn to Trade
Never Miss A Trade Again

Signal Notification
Real-time signal notifications whenever a signal is opened, closes or Updated

Get Alerts
Immediate alerts to your email and mobile phone.

Entry Price Levels
Entry price level for every signal Just choose one of our Top Brokers in the list above to get all this free.