US30 Analysis – February 10
US30 extends constructive momentum within ascending channel structure. US30 continues to exhibit a clearly defined bullish trajectory on the daily timeframe, supported by positively aligned 9- and 21-period moving averages. Price action around $50,090 remains above both dynamic support levels near $49,600 and $49,320, reinforcing overall trend integrity. The moving averages maintain an upward slope, reflecting sustained institutional accumulation rather than speculative surges. Momentum indicators, including MACD, remain in positive territory with expanding histogram bars, signaling continued upside participation and limited distribution risk at present levels.
US30 Key Levels
Resistance Levels: $50000, $51000, $52500
Support Levels: $48000, $45090, $42880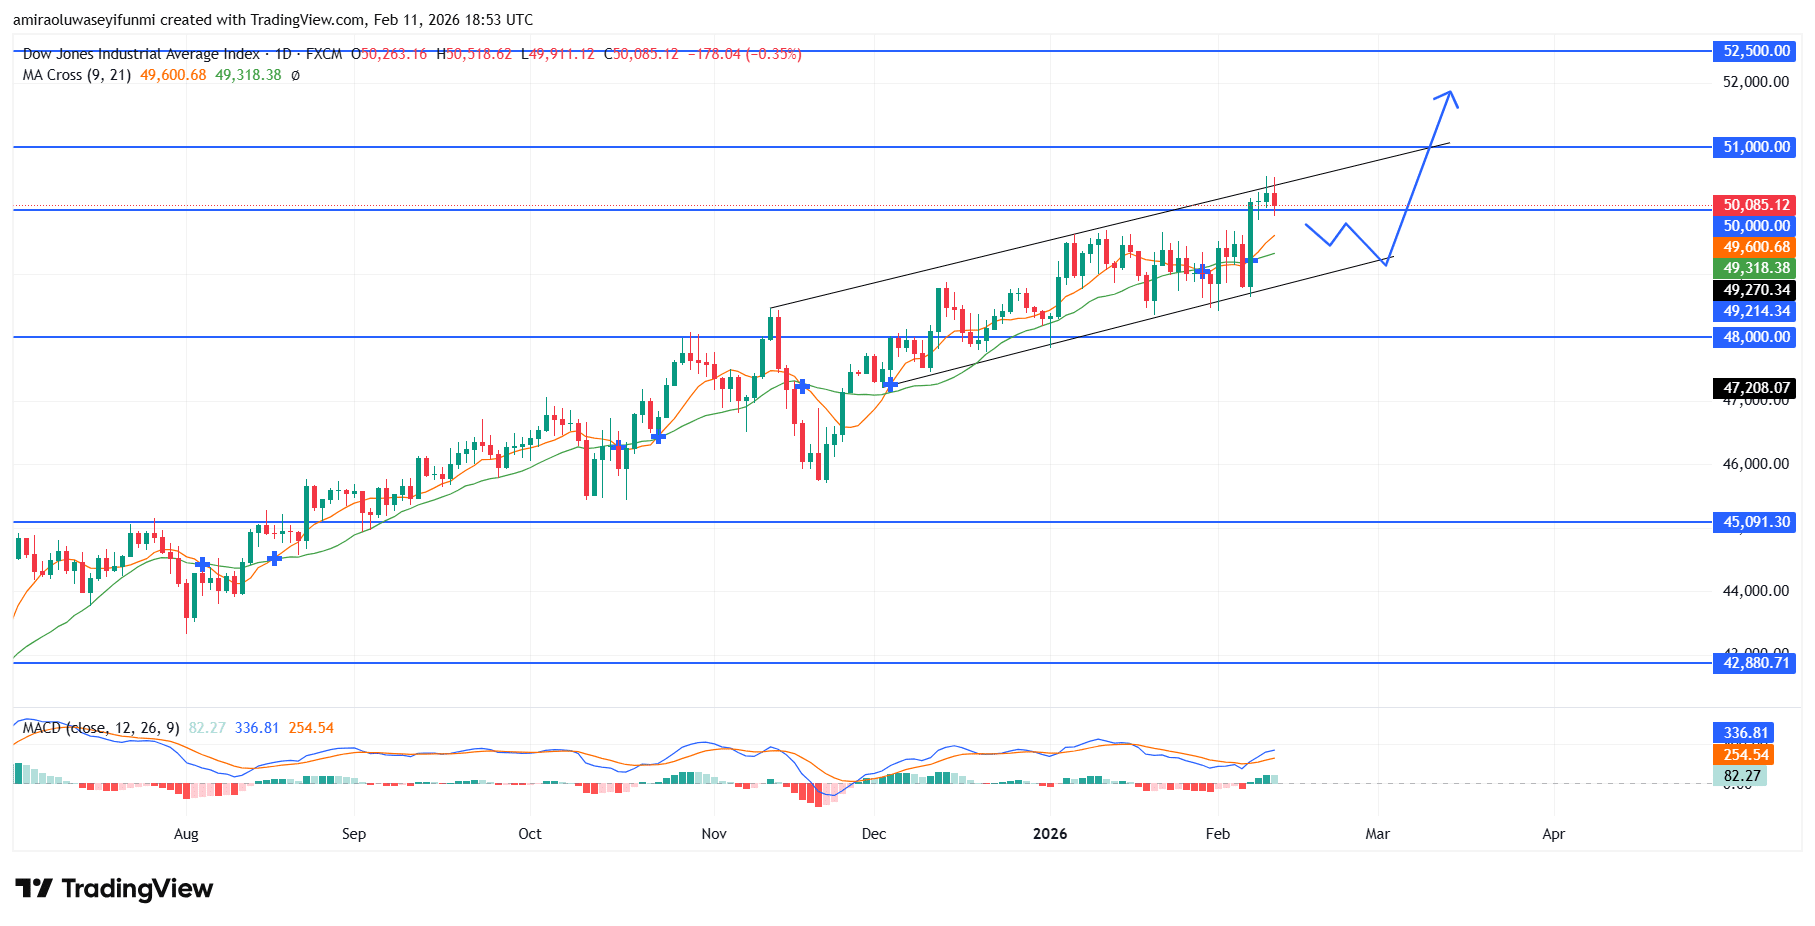
US30 Long-Term Trend: Bullish
From a technical standpoint, price has respected a rising channel formation, generating a sequence of higher highs and higher lows from the $45,090 base through $48,000 and toward the $51,000 resistance region. Recent consolidation between $49,270 and $50,600 appears corrective within the trend rather than indicative of reversal, with buyers defending retracements toward the lower channel boundary near $49,300. The breakout above $48,000 confirmed structural continuation, while the successful retest of $49,300 reinforced demand absorption. Overhead supply is now concentrated near $51,000, with secondary resistance projected around $52,500.
Forward projections continue to favor an upside resolution provided price maintains acceptance above $49,300. A decisive breach of $51,000 would likely trigger continuation toward $52,500, aligning with the upper channel extension. In the case of shallow retracement, pullbacks toward $49,600 or even $49,300 are expected to attract renewed institutional demand. Only a sustained breakdown below $48,000 would materially weaken the prevailing bullish thesis; absent that scenario, the path of least resistance remains higher.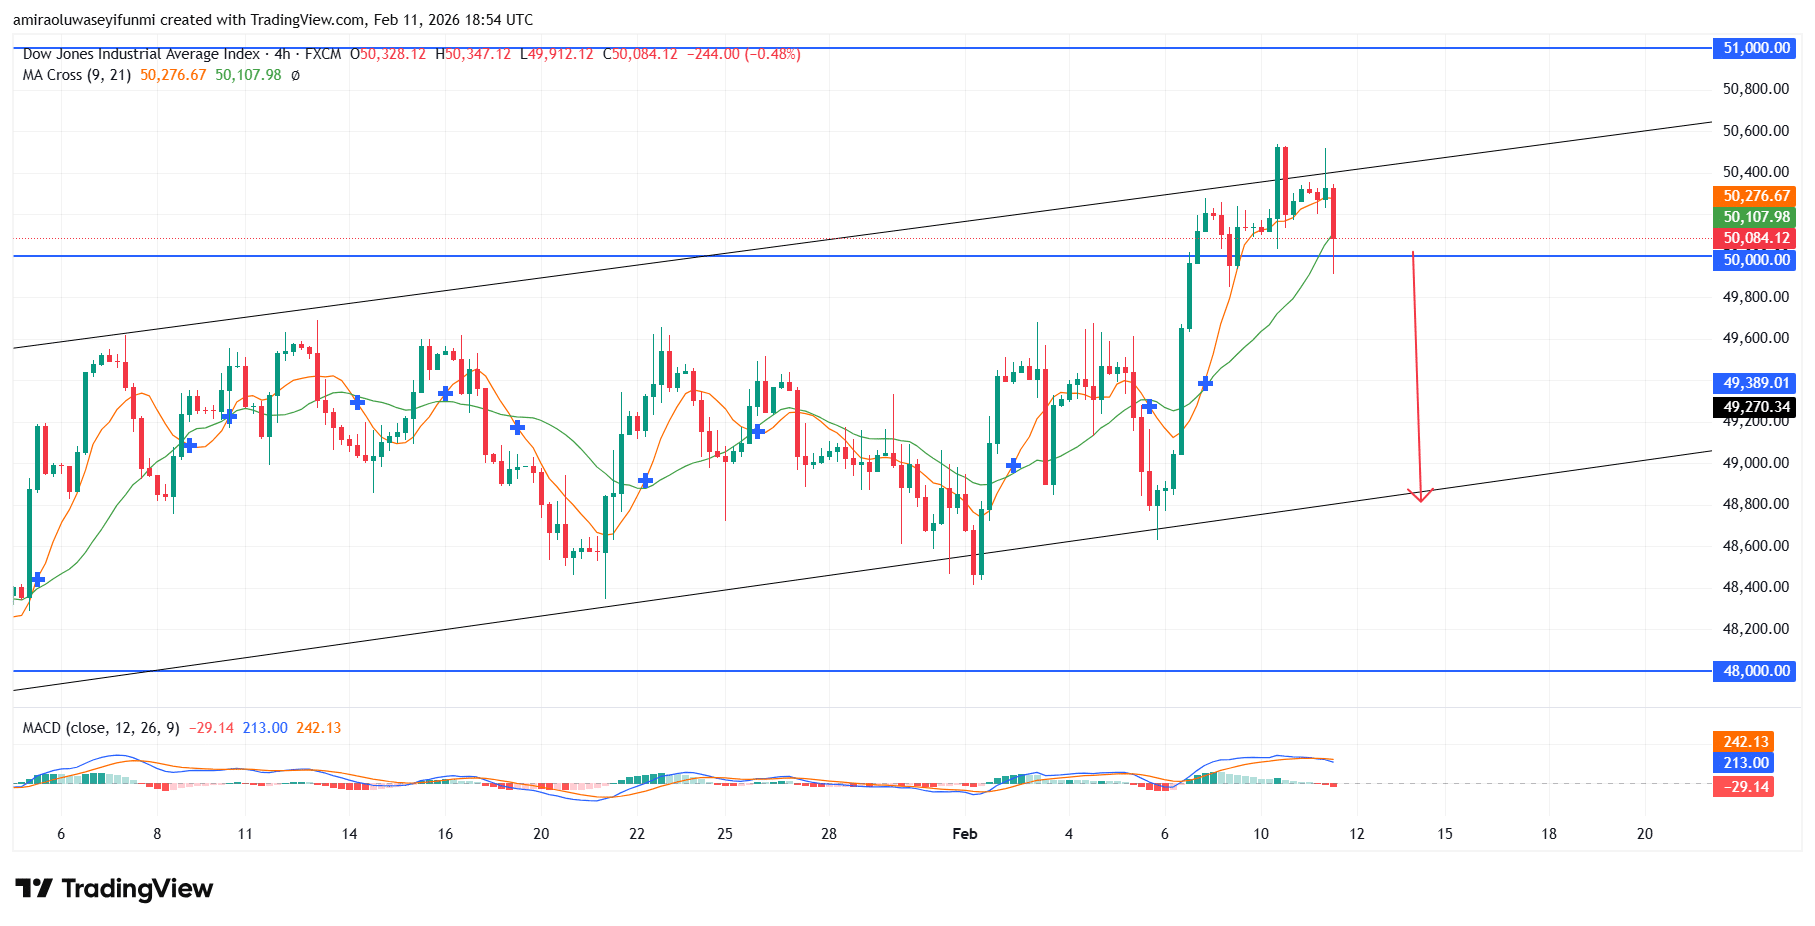
US30 Short-Term Trend: Bearish
On the four-hour chart, US30 is displaying early signs of distribution after rejection near $50,600 within the upper boundary of the rising channel. Price has retreated toward $50,080 and is pressuring short-term support, with moving averages beginning to flatten and lose bullish momentum.
A sustained break below $50,000 would expose $49,390 as the next downside objective, often monitored alongside forex signals for confirmation of directional bias. Failure to hold that level could accelerate declines toward the lower channel support near $48,800.
Make money without lifting your fingers: Start using a world-class auto trading solution
How To Buy Lucky Block
Note: Learn2.trade is not a financial advisor. Do your research before investing your funds in any financial asset, product, or event. We are not responsible for your investment results.
Related Resources
- Stock & Index Trading Signals — alerts for US30, NAS100, S&P 500
- VIP Trading Signals — join 40,000+ traders getting early signals
- Broker
- Min Deposit
- Score
- Visit Broker

- Award-winning Cryptocurrency trading platform
- $100 minimum deposit,
- FCA & Cysec regulated

- 20% welcome bonus of upto $10,000
- Minimum deposit $100
- Verify your account before the bonus is credited
- Fund Moneta Markets account with a minimum of $250
- Opt in using the form to claim your 50% deposit bonus
Learn to Trade
Never Miss A Trade Again

Signal Notification
Real-time signal notifications whenever a signal is opened, closes or Updated

Get Alerts
Immediate alerts to your email and mobile phone.

Entry Price Levels
Entry price level for every signal Just choose one of our Top Brokers in the list above to get all this free.