US30 Analysis – February 3
US30 shows growing downside risk as uptrend loses structural integrity. US30 is no longer displaying the same directional strength that defined its earlier advance, as momentum conditions continue to unwind and indicator alignment weakens. While price remains marginally above the short-term moving averages around $49,200, their flattening slope reflects a slowdown in buying pressure rather than sustained trend continuation. Momentum readings confirm this transition, with the MACD losing expansion and drifting toward equilibrium, signaling that bullish commitment is thinning within a maturing trend environment.
US30 Key Levels
Resistance Levels: $50000, $51000, $52500
Support Levels: $48000, $45090, $42880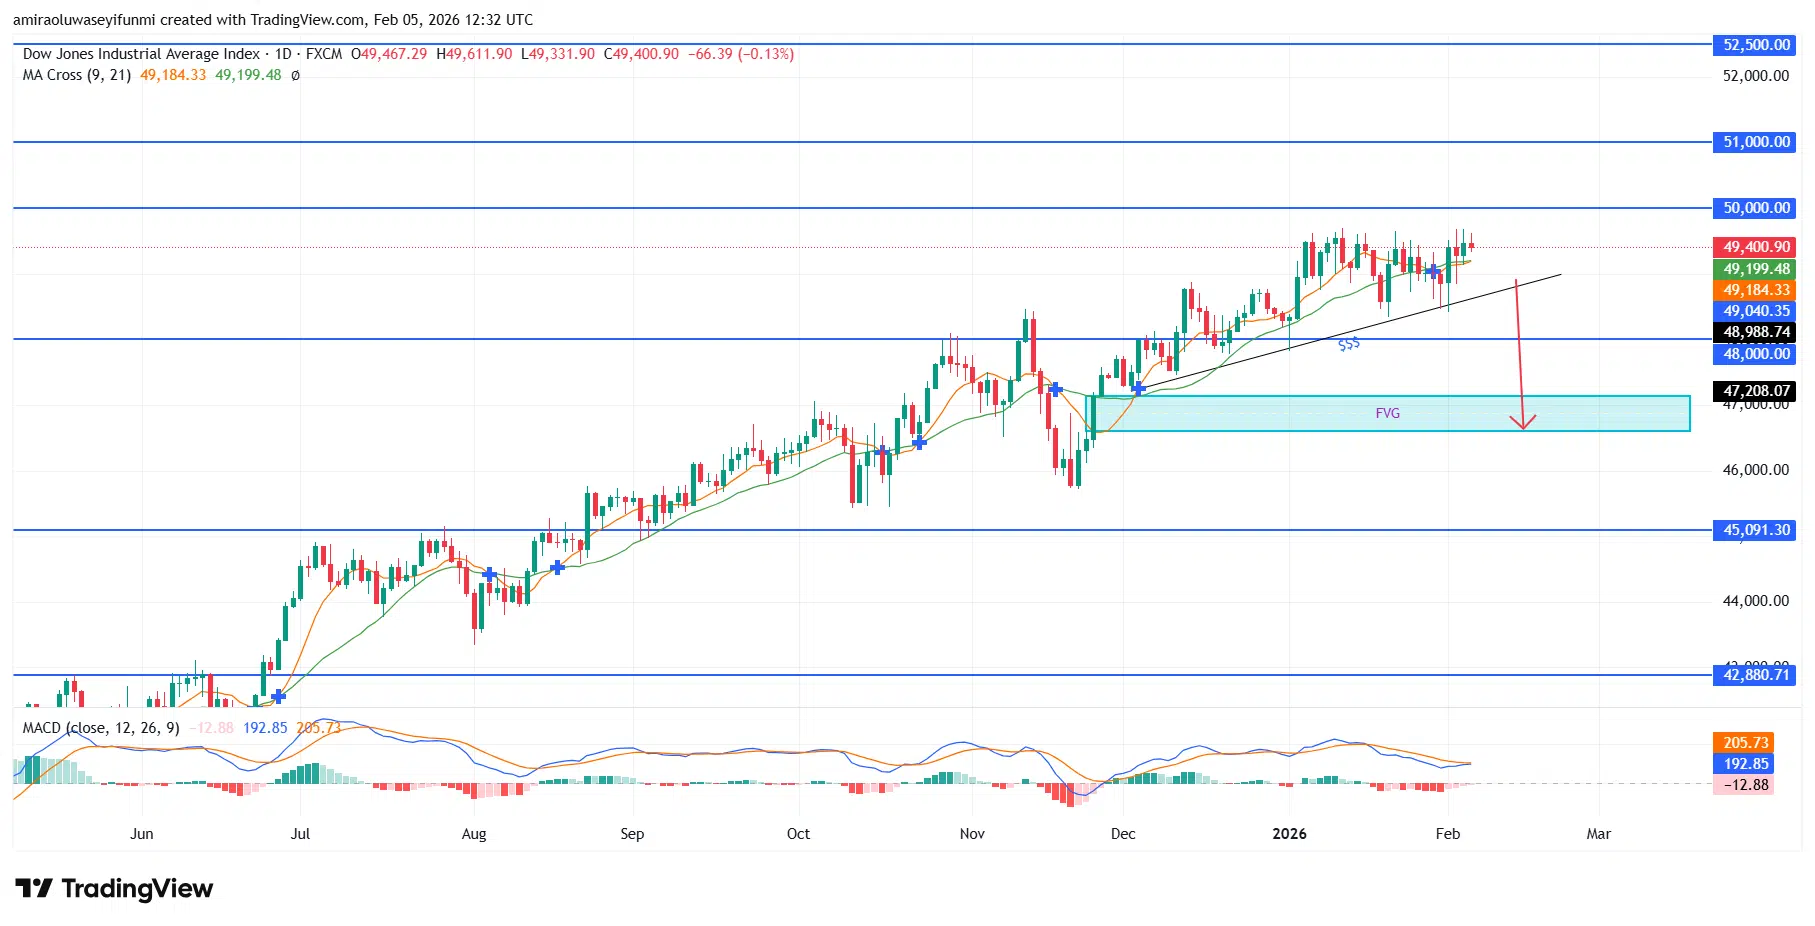
US30 Long-Term Trend: Bearish
From a technical perspective, price behavior continues to reflect an active distribution phase below the $49,500–$49,600 resistance zone. Repeated rejection from this ceiling highlights persistent overhead supply, while the ascending support line extending from November is being increasingly compressed near $49,000. The lack of strong follow-through candles, combined with overlapping range-bound price action, suggests demand is becoming reactive rather than initiative-driven. With $48,900 failing to act as a dependable base, price is now increasingly exposed to a lower imbalance zone centered around $47,200.
Looking ahead, US30 remains vulnerable to further downside rotation should $49,000 fail to hold on a closing basis. A decisive breakdown would likely accelerate losses toward the $47,200 area, with scope for a deeper extension into the $45,100 region if broader risk-off sentiment intensifies. Interim rebounds toward the $49,400–$49,500 range are expected to attract renewed selling interest, keeping the broader directional bias tilted to the downside unless price can reclaim and sustain levels above $50,000.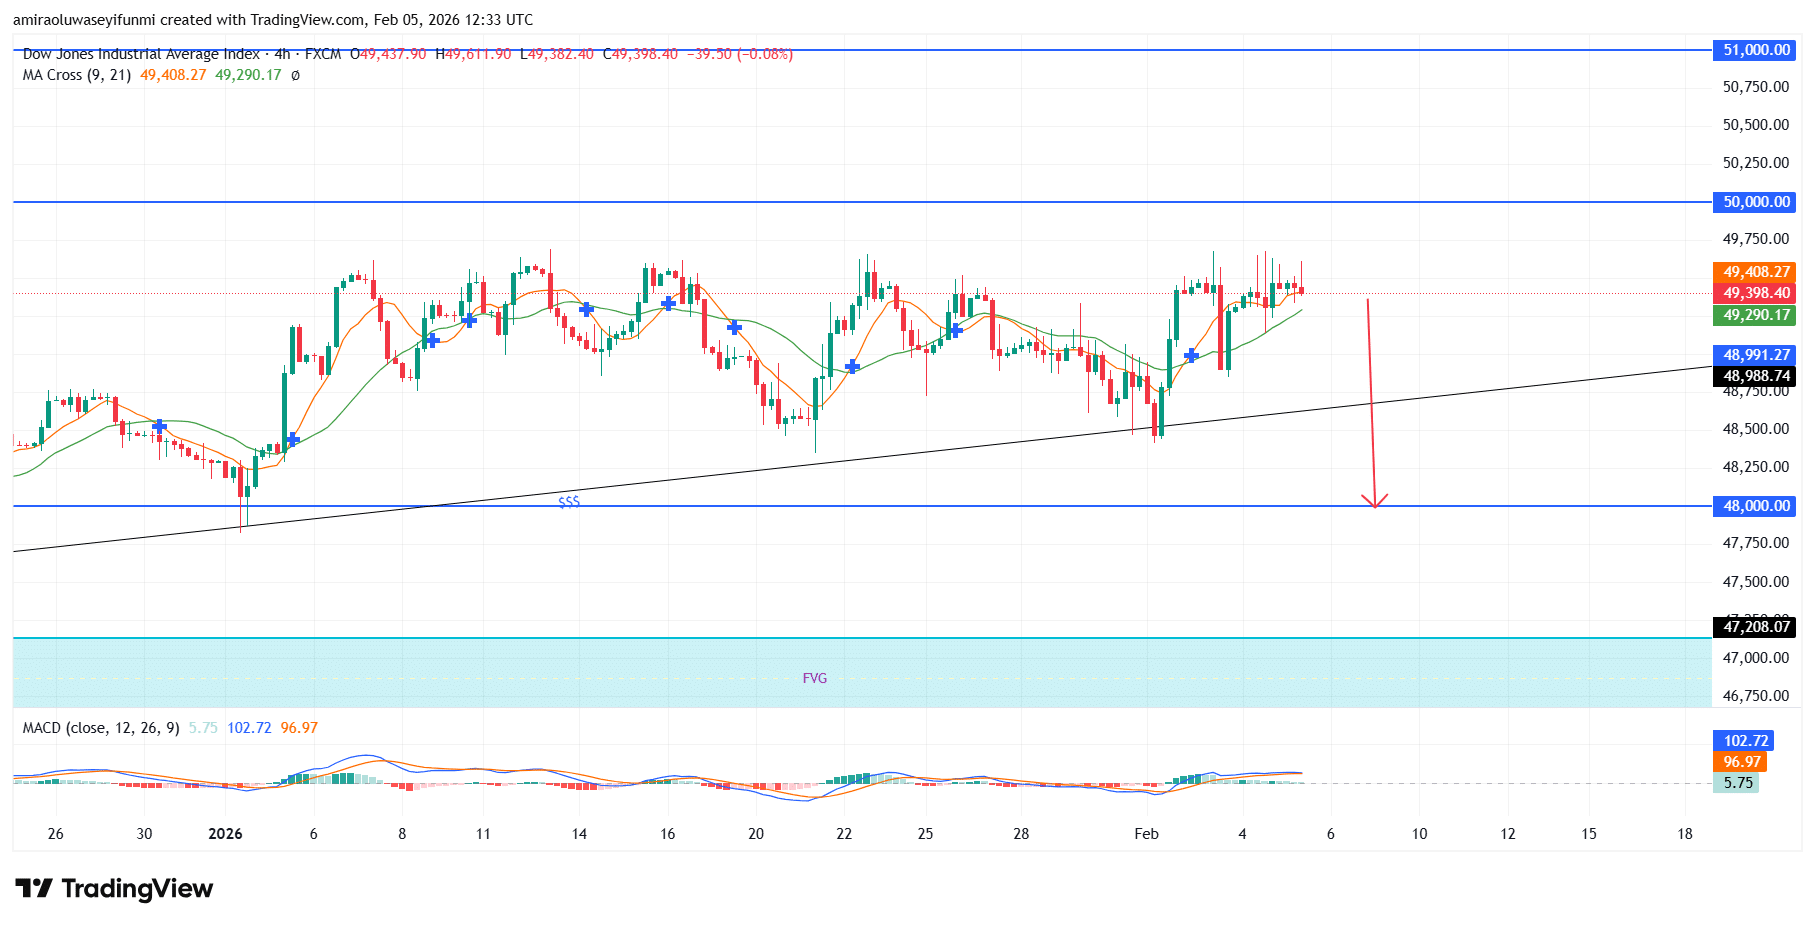
US30 Short-Term Trend: Bearish
On the four-hour chart, US30 continues to exhibit a bearish bias as price struggles to maintain momentum above the short-term moving averages clustered around $49,300–$49,400. Momentum indicators remain subdued, with the MACD losing upside traction, reinforcing the view of weakening bullish follow-through rather than trend expansion.
Structurally, price remains capped beneath the $49,500 supply zone, while repeated tests of the rising trendline near $49,000 increase the likelihood of a downside break. A confirmed loss of $49,000 would likely expose $48,000 initially, with extended downside risk toward the $47,200 fair value gap in line with prevailing forex signals.
Make money without lifting your fingers: Start using a world-class auto trading solution
How To Buy Lucky Block
Note: Learn2.trade is not a financial advisor. Do your research before investing your funds in any financial asset, product, or event. We are not responsible for your investment results.
- Broker
- Min Deposit
- Score
- Visit Broker

- Award-winning Cryptocurrency trading platform
- $100 minimum deposit,
- FCA & Cysec regulated

- 20% welcome bonus of upto $10,000
- Minimum deposit $100
- Verify your account before the bonus is credited
- Fund Moneta Markets account with a minimum of $250
- Opt in using the form to claim your 50% deposit bonus
Learn to Trade
Never Miss A Trade Again

Signal Notification
Real-time signal notifications whenever a signal is opened, closes or Updated

Get Alerts
Immediate alerts to your email and mobile phone.

Entry Price Levels
Entry price level for every signal Just choose one of our Top Brokers in the list above to get all this free.