US30 Analysis – January 27
US30 is poised for continuation higher following a structured pullback phase. The index remains within a well-defined medium-term uptrend, with price action broadly supported by momentum indicators despite recent slowing. US30 continues to trade above its rising short-term moving average near $49,150, reflecting healthy trend participation, while the MACD remains in positive territory but has begun to flatten, a condition consistent with consolidation rather than trend reversal. This alignment suggests bullish conditions remain intact, with room for a corrective pause to reset momentum ahead of continuation.
US30 Key Levels
Resistance Levels: $50000, $51000, $52500
Support Levels: $47000, $45090, $42880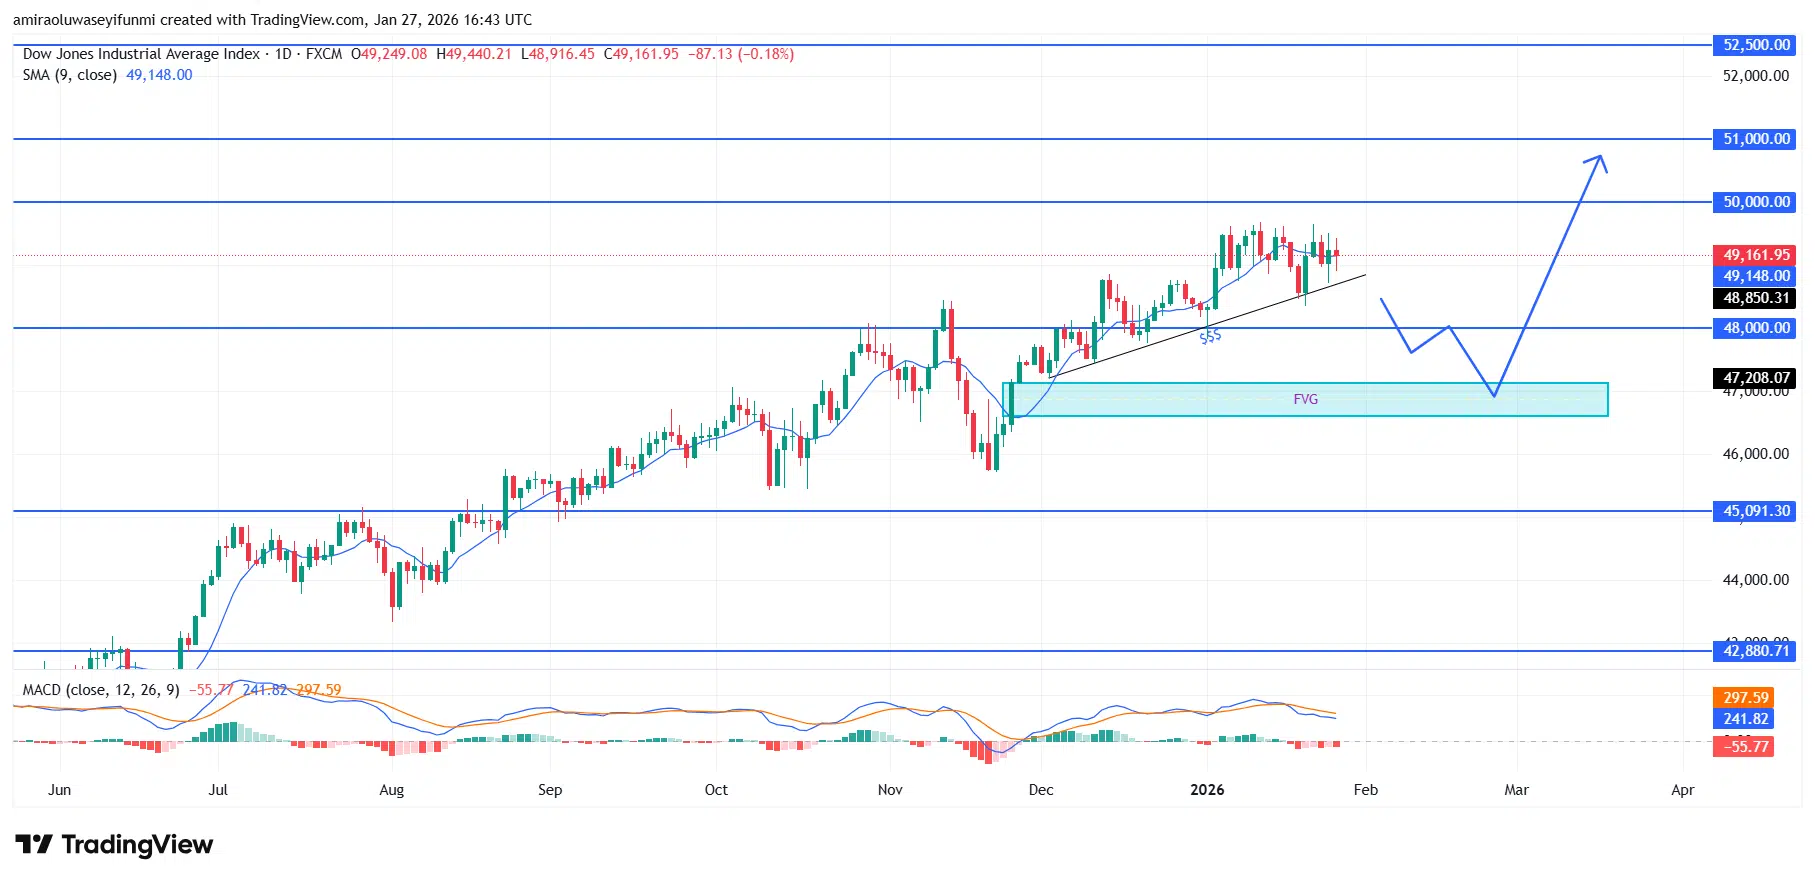
US30 Long-Term Trend: Bullish
The index has preserved its bullish structure since rebounding from the $45,100 base, consistently printing higher swing highs and higher lows. The inability to decisively break above the $49,500 region indicates overhead supply is being gradually absorbed, creating scope for a measured pullback toward $48,000. A deeper retracement into the $47,200–$47,000 fair value gap would remain technically constructive, provided price continues to respect the key structural support at $45,100.
Should price experience a controlled retracement and attract responsive demand between $48,000 and $47,200, the broader bullish framework would likely reassert itself. From that base, upside projections realign toward $50,000 initially, with potential extension through $51,000 if momentum expands. A failure below $47,000 would postpone the bullish scenario; however, as long as daily closes remain above $45,100, the broader outlook continues to favor higher prices following the pullback, a bias often reinforced when aligned with broader forex signals.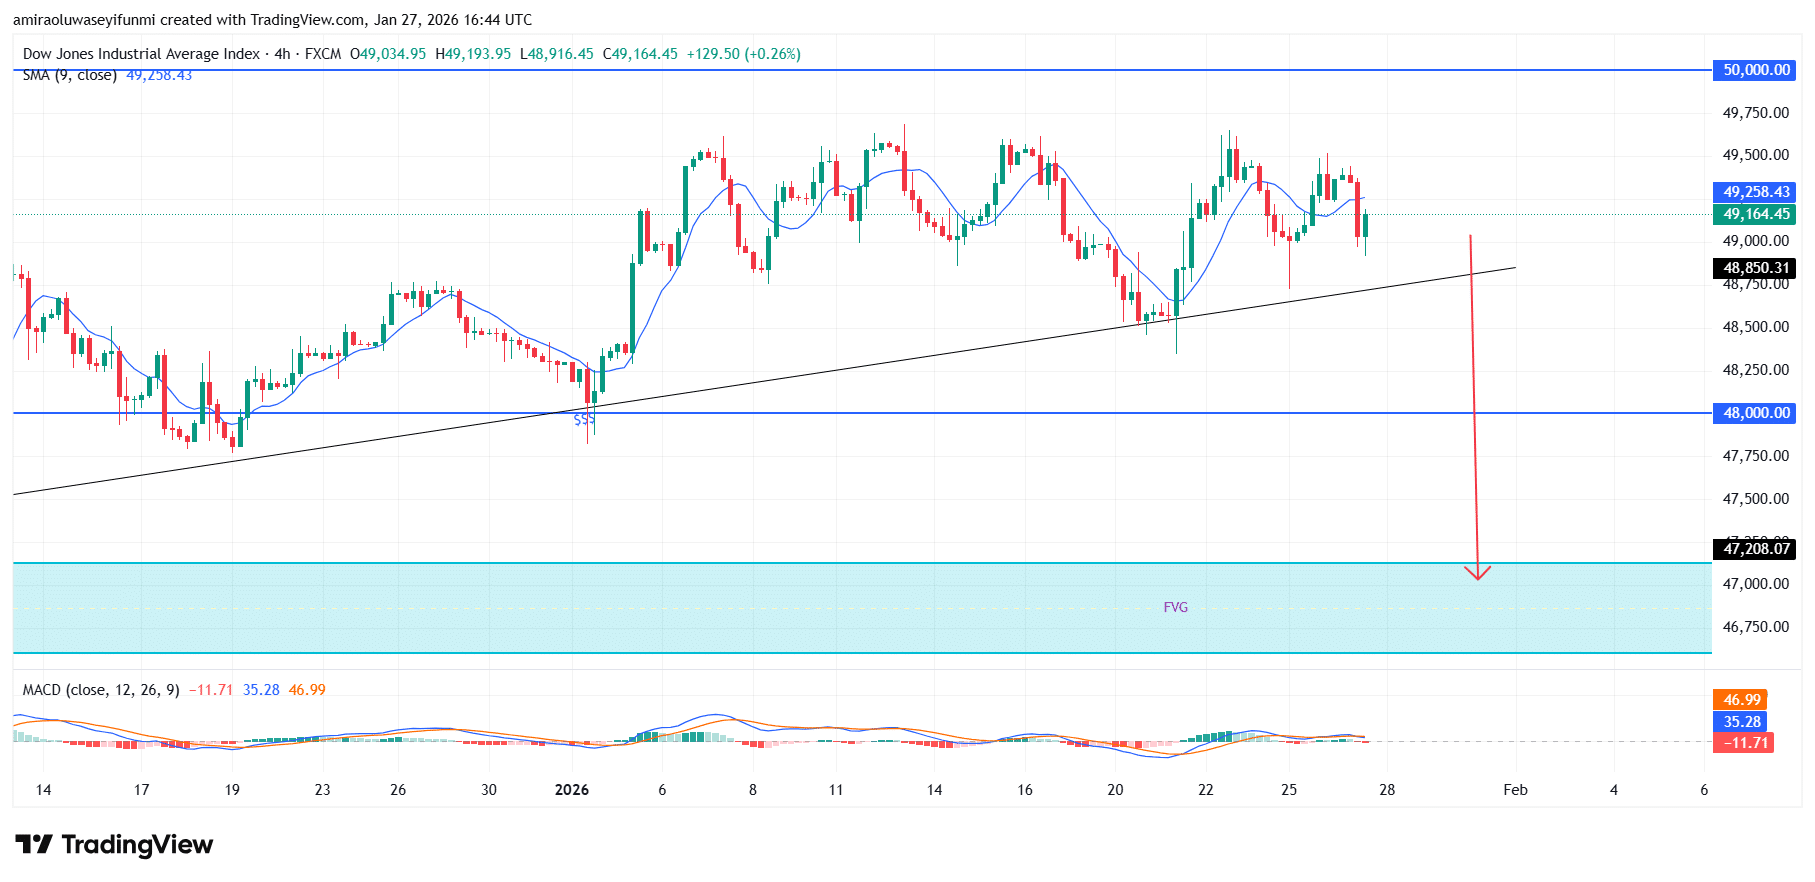
US30 Short-Term Trend: Bearish
On the four-hour timeframe, US30 is exhibiting a short-term bearish bias as price struggles to sustain trade above the rising trendline and the 9-period moving average near $49,250. Repeated rejections beneath the $49,500 area highlight waning upside momentum and increasing distribution pressure.
The MACD is flattening and showing early signs of a bearish crossover, signaling fading bullish strength. A sustained break below $48,850 would likely trigger downside continuation toward the $48,000 level and the lower fair value gap zone.
Make money without lifting your fingers: Start using a world-class auto trading solution
How To Buy Lucky Block
Note: Learn2.trade is not a financial advisor. Do your research before investing your funds in any financial asset, product, or event. We are not responsible for your investment results.
- Broker
- Min Deposit
- Score
- Visit Broker

- Award-winning Cryptocurrency trading platform
- $100 minimum deposit,
- FCA & Cysec regulated

- 20% welcome bonus of upto $10,000
- Minimum deposit $100
- Verify your account before the bonus is credited
- Fund Moneta Markets account with a minimum of $250
- Opt in using the form to claim your 50% deposit bonus
Learn to Trade
Never Miss A Trade Again

Signal Notification
Real-time signal notifications whenever a signal is opened, closes or Updated

Get Alerts
Immediate alerts to your email and mobile phone.

Entry Price Levels
Entry price level for every signal Just choose one of our Top Brokers in the list above to get all this free.