US30 Analysis – January 20
US30 shows fading upside as sellers dominate elevated valuations. US30 is gradually transitioning out of a prolonged expansion phase into a consolidation-to-decline environment, as momentum signals lose alignment with earlier bullish strength. Price has moved below the short-term moving average near $49,260, signaling weakening near-term trend control. Concurrently, RSI has retreated from the mid-60s into the low-50s zone, reflecting cooling demand conditions and a shift toward softer momentum dynamics.
US30 Key Levels
Resistance Levels: $50000, $51000, $52500
Support Levels: $48000, $45090, $42880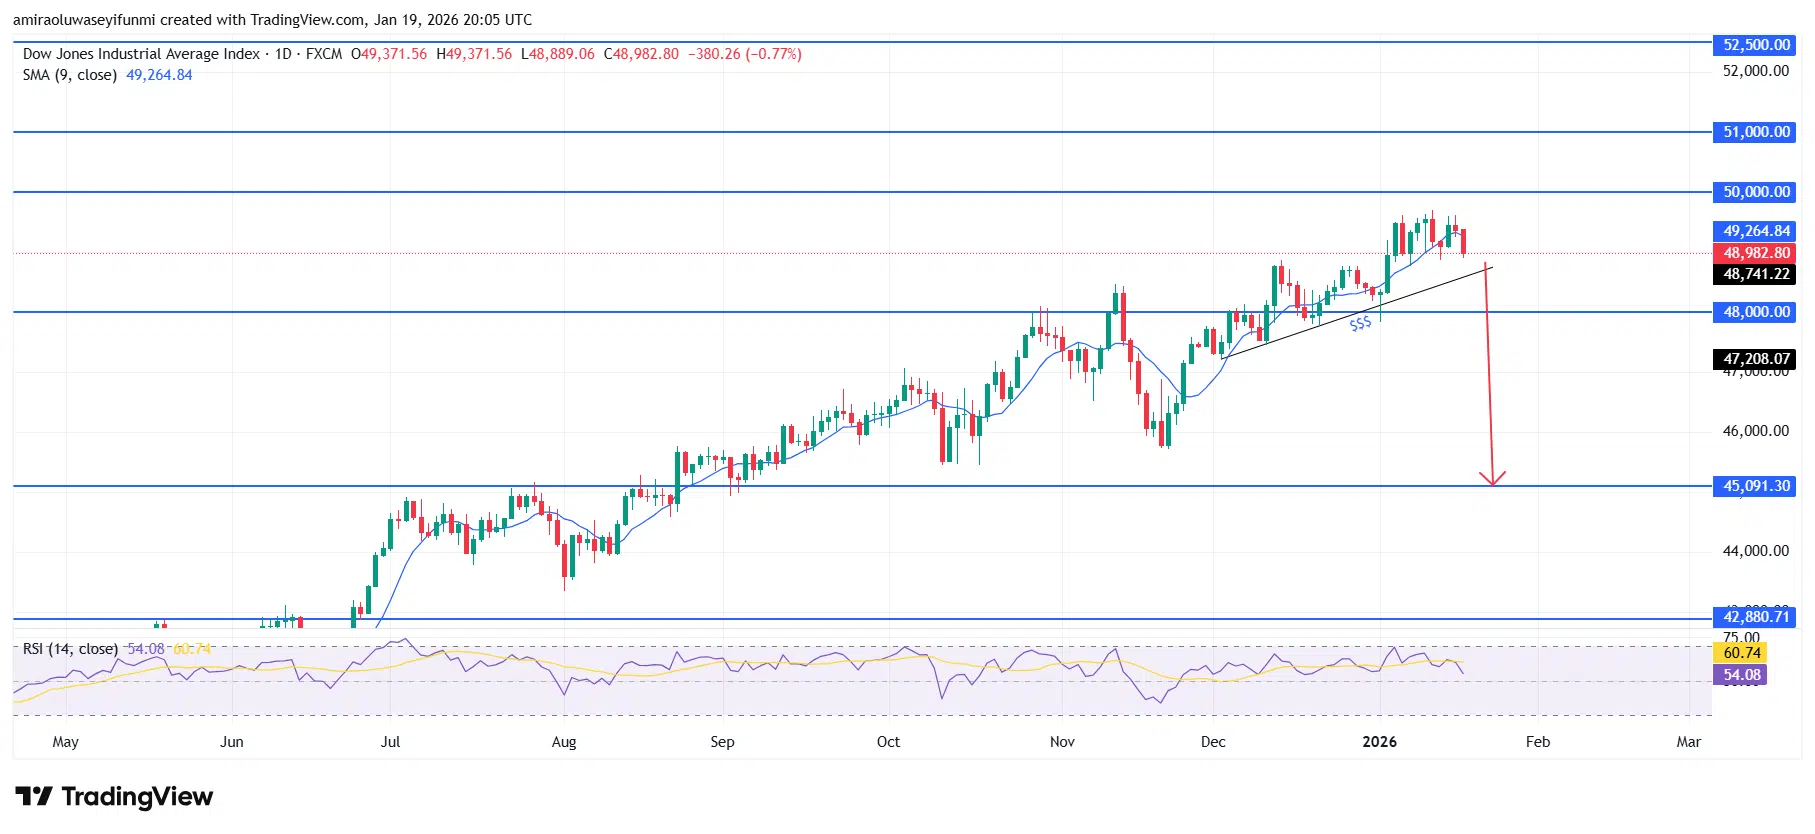
US30 Long-Term Trend: Bearish
Price action reflects increasing supply pressure following repeated failures to sustain trade above the $49,500–$50,000 resistance corridor. The development of lower swing highs beneath this region, combined with a decisive break of the rising trendline, confirms a meaningful structural change in market behavior. Continued rejection near $49,000 has established this area as firm overhead resistance, while widening downside ranges point to growing seller conviction toward the $48,000 zone.
From a forward-looking standpoint, the broader technical setup continues to favor downside continuation unless the index can reclaim and hold above $49,300. A confirmed break below $48,000 would likely expand downside exposure toward the $47,200 support area, with potential for a deeper move toward $45,100 if selling pressure accelerates. Within this framework, upside rebounds are expected to remain corrective in nature, aligning with prevailing forex signals rather than indicating a renewed bullish trend.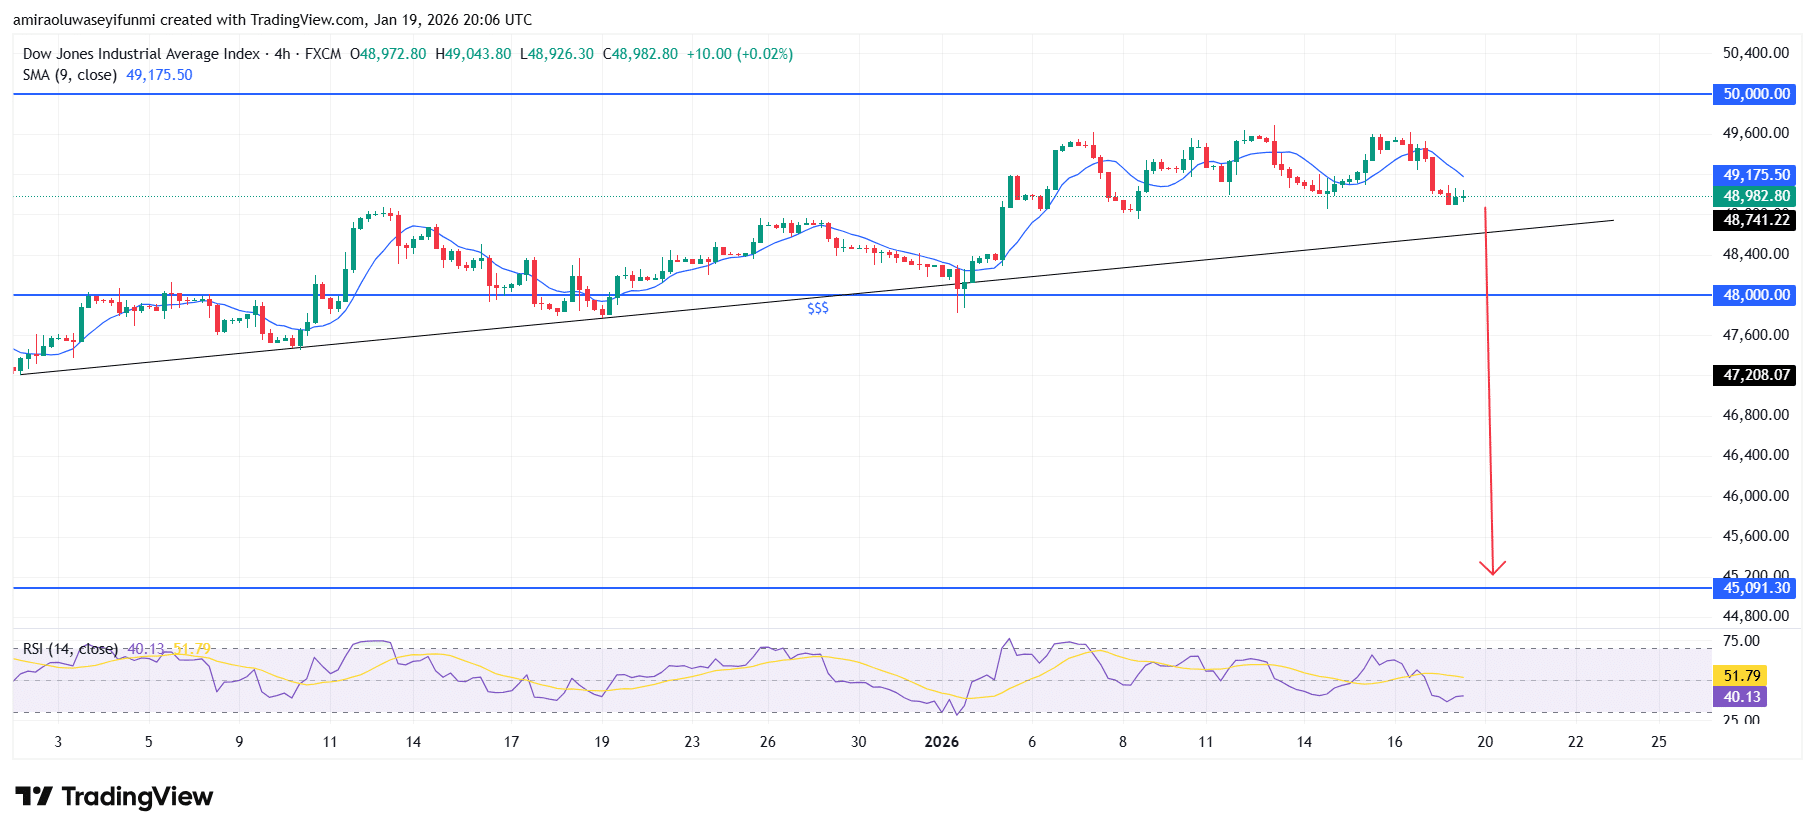
US30 Short-Term Trend: Bearish
US30 on the four-hour chart is displaying a clear bearish shift, with price trading below the short-term moving average near $49,180 as momentum continues to weaken. Repeated rejection beneath the $49,500–$50,000 resistance band highlights persistent supply and limited upside follow-through.
The recent breakdown below the ascending trendline around $48,800 signals a loss of structural support and reinforces downside risk. Should selling pressure persist, price is likely to extend lower toward $48,000 and potentially the $45,100 demand area.
Make money without lifting your fingers: Start using a world-class auto trading solution
How To Buy Lucky Block
Note: Learn2.trade is not a financial advisor. Do your research before investing your funds in any financial asset, product, or event. We are not responsible for your investment results.
- Broker
- Min Deposit
- Score
- Visit Broker

- Award-winning Cryptocurrency trading platform
- $100 minimum deposit,
- FCA & Cysec regulated

- 20% welcome bonus of upto $10,000
- Minimum deposit $100
- Verify your account before the bonus is credited
- Fund Moneta Markets account with a minimum of $250
- Opt in using the form to claim your 50% deposit bonus
Learn to Trade
Never Miss A Trade Again

Signal Notification
Real-time signal notifications whenever a signal is opened, closes or Updated

Get Alerts
Immediate alerts to your email and mobile phone.

Entry Price Levels
Entry price level for every signal Just choose one of our Top Brokers in the list above to get all this free.