

US30 Analysis – January 13
US30 signals downside transition as bullish drive loses strength. US30 is starting to reflect a shift in directional balance as upside momentum shows clear signs of fatigue near recent highs. Although price continues to hover above the short-term moving average around $49,150, indicator alignment suggests slowing internal strength rather than trend continuation. The MACD’s loss of slope and subdued histogram activity point to weakening buying conviction, increasing the likelihood of a corrective phase taking shape.
US30 Key Levels
Resistance Levels: $50000, $51000, $52500
Support Levels: $48000, $45090, $42880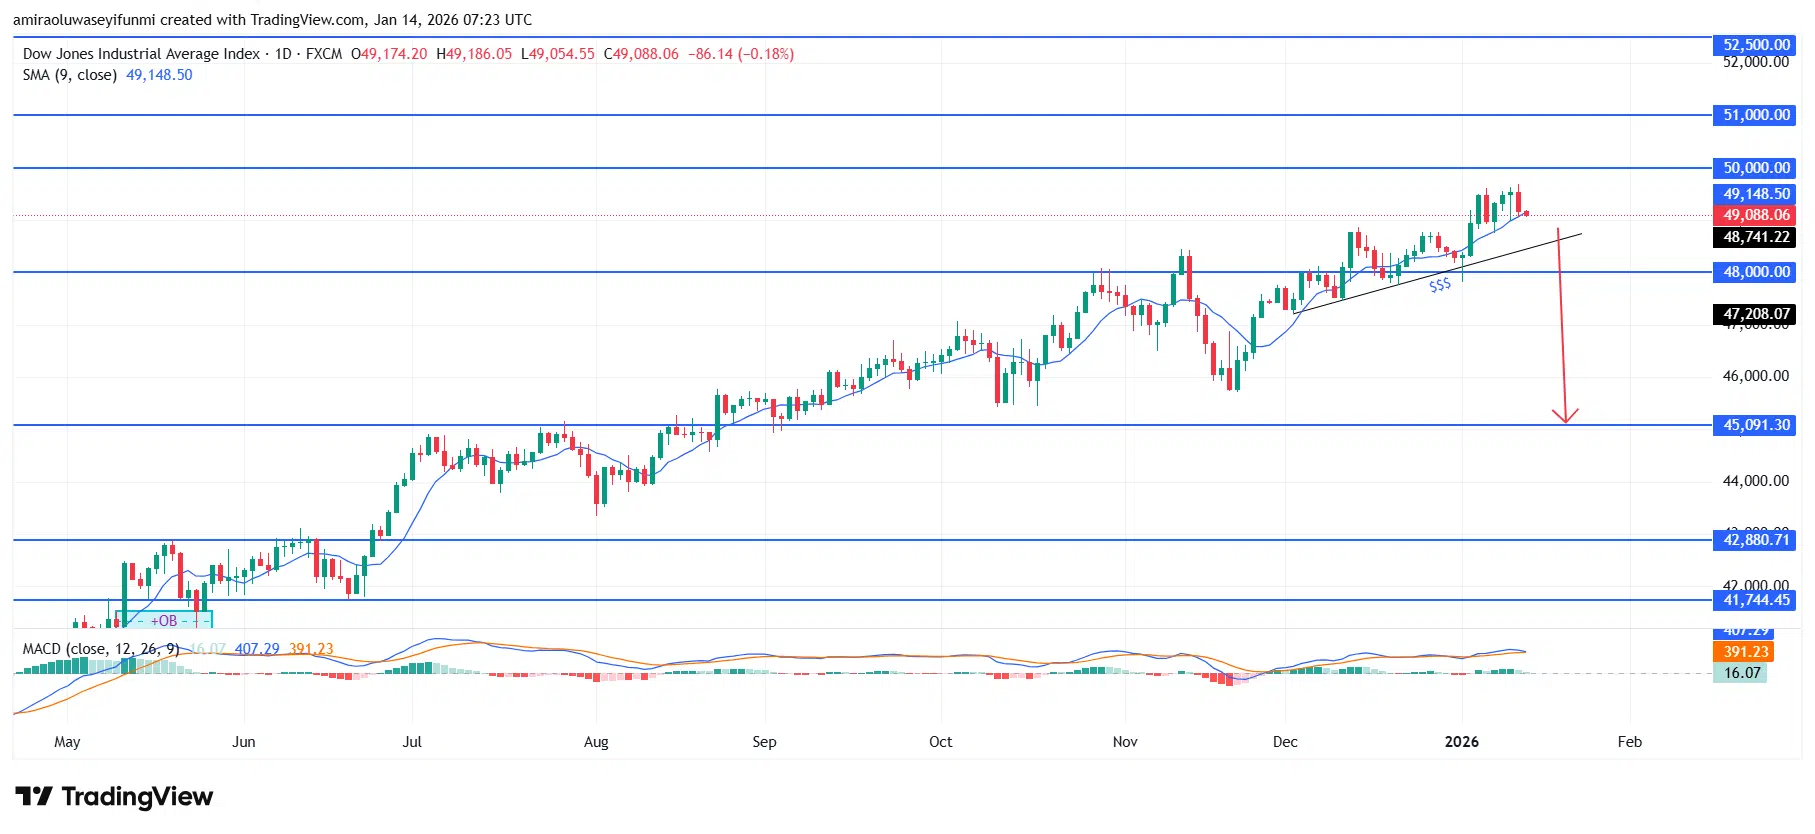
US30 Long-Term Trend: Bearish
From a technical perspective, price action has become increasingly constrained following repeated failures to establish value above the $49,800–$50,000 supply band. The index is consolidating near the upper boundary of its prior advancing structure, with the $48,700 to $48,000 region acting as a fragile near-term base. A rising trendline beneath current levels adds structural pressure, as a decisive break would signal a meaningful shift in market control rather than routine consolidation.
Looking ahead, a confirmed move below $48,000 would likely attract stronger sell-side participation, exposing the $45,100 area as the next downside objective. If that level fails to generate sufficient demand, extended weakness could drive price toward the $42,880 support zone. In the absence of a sustained recovery above $50,000, the broader outlook remains skewed toward a deeper bearish adjustment.
US30 Short-Term Trend: Bearish
US30 on the four-hour chart is showing a bearish transition as price trades below the 9-period moving average, signaling weakening short-term momentum. The recent rejection from the $49,300 to $49,600 zone highlights strong overhead supply and fading bullish follow-through.
Price is also gravitating toward a retest of the rising trendline and the $48,000 support area, which now serves as a key downside magnet. With MACD momentum rolling over below the signal line, near-term forex signals continue to favor a deeper corrective move within the broader bearish structure.
Make money without lifting your fingers: Start using a world-class auto trading solution
How To Buy Lucky Block
Note: Learn2.trade is not a financial advisor. Do your research before investing your funds in any financial asset, product, or event. We are not responsible for your investment results.
- Broker
- Min Deposit
- Score
- Visit Broker

- Award-winning Cryptocurrency trading platform
- $100 minimum deposit,
- FCA & Cysec regulated

- 20% welcome bonus of upto $10,000
- Minimum deposit $100
- Verify your account before the bonus is credited


- Fund Moneta Markets account with a minimum of $250
- Opt in using the form to claim your 50% deposit bonus


