FTSE 100 Analysis – February 11
FTSE 100 upholds a propulsive upside bias beyond long-term highs. The FTSE 100 continues to display an ascending structural cadence characterized by sequential peak elevation and trough advancement on the daily horizon. Spot valuation holds decisively above the 9-session and 21-session mean baselines, orbiting approximately $10,370 and $10,260, thereby affirming synchronized short- and intermediate-cycle orientation. The moving averages remain positively tiered and gradually diverging, underscoring directional persistence. Concurrently, MACD oscillates within constructive territory with incremental histogram expansion, implying sustained upward propulsion rather than terminal fatigue.
FTSE 100 Key Levels
Supply Levels: $10,400, $10,600, $11000
Demand Levels: $10100, $9700, $9350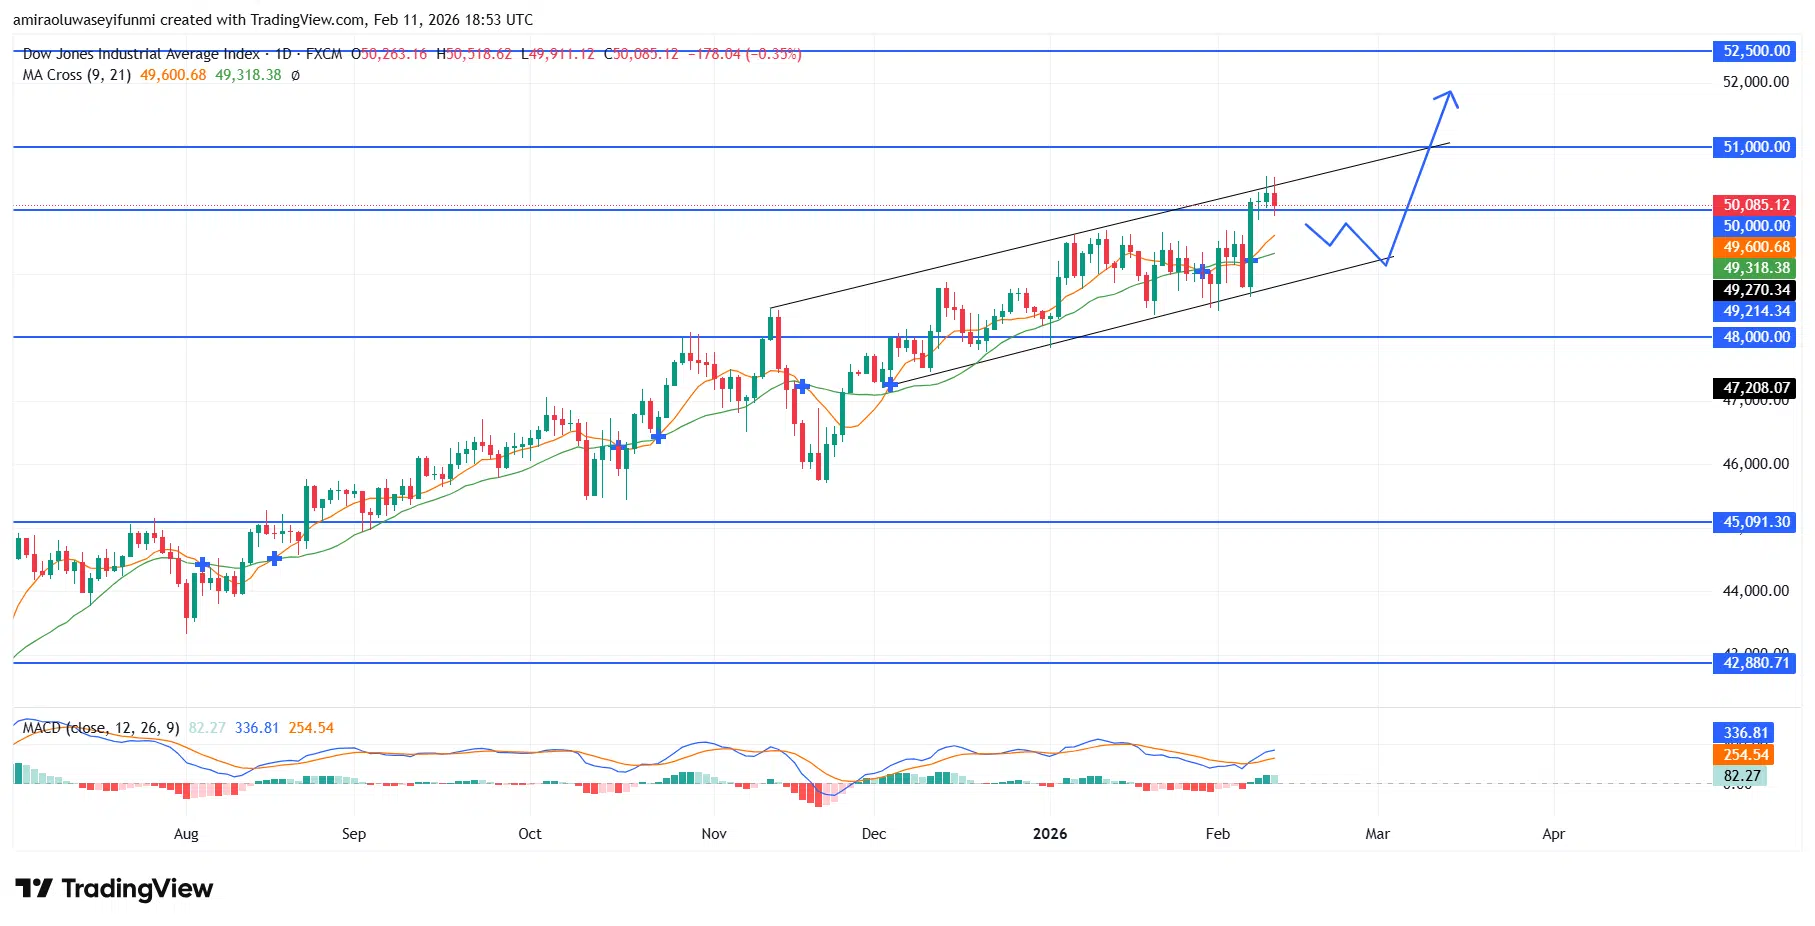
FTSE100 Long-Term Trend: Bullish
The index has breached the $10,400 supply ceiling and is now consolidating marginally above that threshold, effectively reclassifying prior distribution into a demand floor. The ongoing retracement exhibits a moderate, absorptive quality, with bids clustering between $10,300 and $10,350, comfortably above the $10,100 structural bastion. This rotation implies methodical inventory redistribution rather than distributive unwinding. The prevailing configuration reflects a continuation framework, with price compression above $10,400 signaling latent expansion potential. Overhead resistance is projected near $10,600, with the $11,000 macro-psychological marker beyond.
Looking ahead, sustained settlement above $10,300 preserves the probabilistic pathway toward $10,600 in the near term, with extension targets pointing toward $10,800 and ultimately the $11,000 frontier. A decisive clearance through $10,600 would likely catalyze incremental order-flow acceleration and attract systematic trend participants. Only a durable breach beneath $10,100 would weaken the constructive premise. In the absence of such structural impairment, the prevailing framework continues to support measured appreciation within an intact upward regime.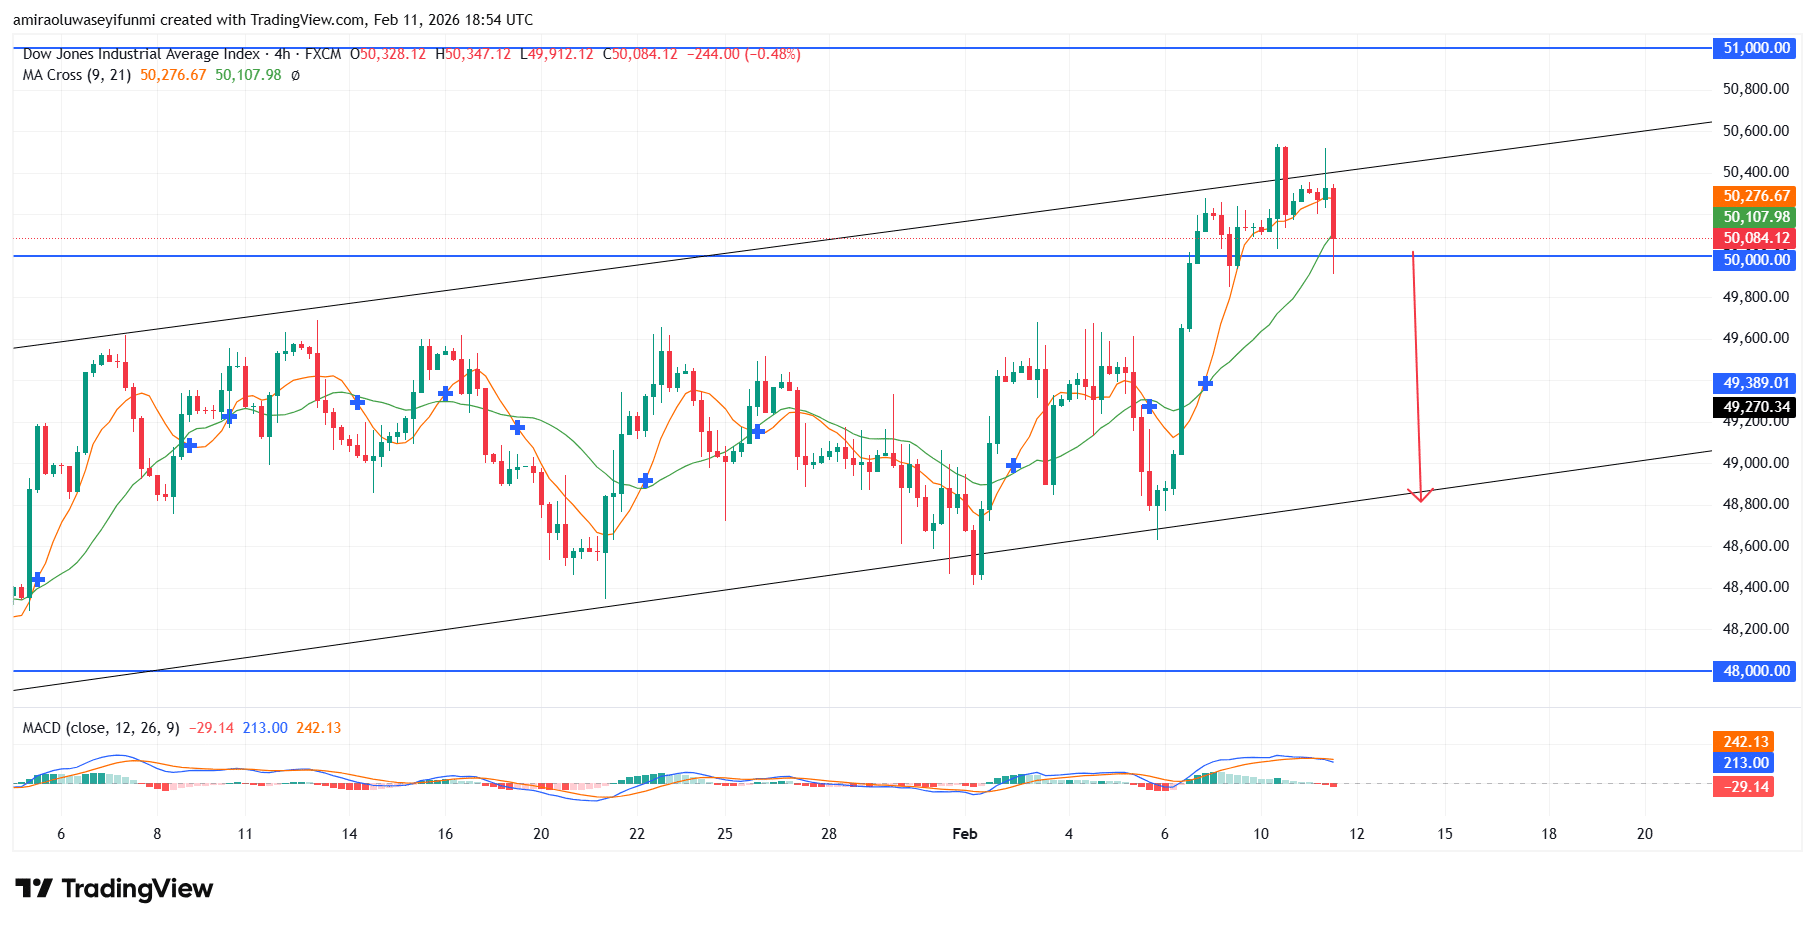
FTSE100 Short-Term Trend: Bearish
On the four-hour timeframe, FTSE 100 is exhibiting corrective weakness after failing to sustain acceptance above the $10,500 region. Price has rotated below the $10,420 area and is testing the 9- and 21-period moving averages near $10,400 and $10,390, signaling short-term momentum deterioration.
The MACD histogram is flattening near the zero line, reflecting fading bullish impulse and increasing downside risk. A sustained break below $10,300 is likely to expose liquidity toward $10,160 and potentially $10,100 as the next technical support levels, a scenario often monitored alongside forex signals for confirmation of directional shifts.
Make money without lifting your fingers: Start using a world-class auto trading solution
How To Buy Lucky Block
Note: Learn2.trade is not a financial advisor. Do your research before investing your funds in any financial asset, product, or event. We are not responsible for your investment results.
- Broker
- Min Deposit
- Score
- Visit Broker

- Award-winning Cryptocurrency trading platform
- $100 minimum deposit,
- FCA & Cysec regulated

- 20% welcome bonus of upto $10,000
- Minimum deposit $100
- Verify your account before the bonus is credited
- Fund Moneta Markets account with a minimum of $250
- Opt in using the form to claim your 50% deposit bonus
Learn to Trade
Never Miss A Trade Again

Signal Notification
Real-time signal notifications whenever a signal is opened, closes or Updated

Get Alerts
Immediate alerts to your email and mobile phone.

Entry Price Levels
Entry price level for every signal Just choose one of our Top Brokers in the list above to get all this free.