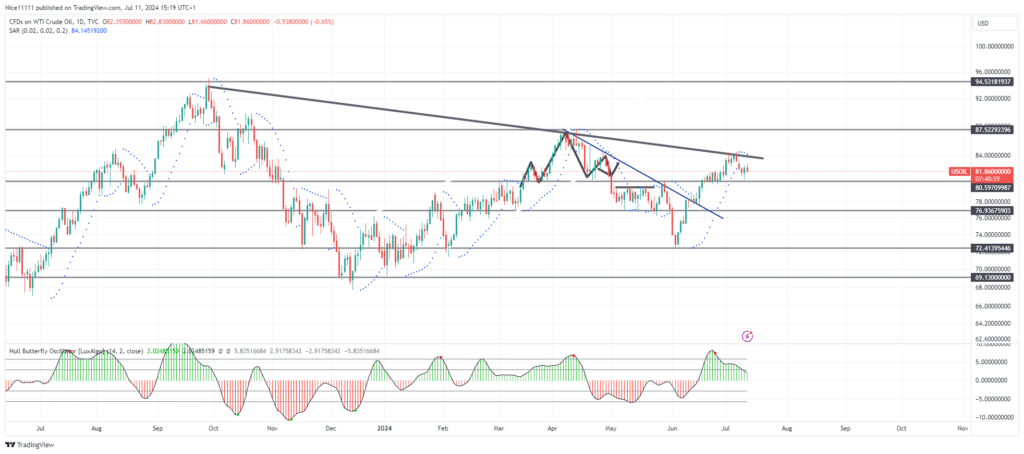
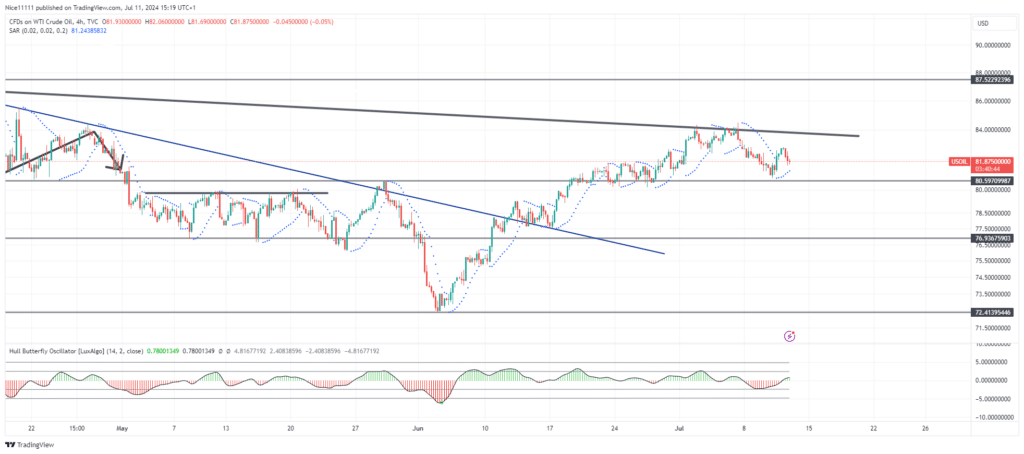
US Oil price action has shown sensitivity to the bearish trendline, evidenced by a repel witnessed after testing a bearish and prominent trendline. The strong bearish trend is threatened as the trendline plays a resistance role to the ascent of the US Oil price.
US Oil Key Levels
Demand Levels: 80.60, 76.90, 77.40 Supply Levels: 87.50, 94.50, 100.00
On the 24-hour timeframe, two major swing highs are very prominent. These are the swing highs formed in September and April. The swing highs were connected to anticipate a future price reversal, which is currently experienced in the US Oil market.
The bullish momentum has been very strong since early June. This is seen on the Hull Butterfly Indicator as bearish (red histogram bars) momentum declines and turns bullish (green histogram signs). The Parabolic SAR (Stop and Reverse) also aligned below the daily candles, showing a bullish stance.
Shortly after the test of the swing high, the Parabolic SAR points switched positions to rest above the daily candles, indicating a price decline. Similarly, the length of the green hues on the Hull Butterfly Indicator is reducing towards zero, revealing a wane in the bullish momentum. This is evident in the market on trading platforms.
US Oil Short-term Trend: Bearish
The market structure is still bullish, though a price decline has initiated. The break of the demand level of 80.60 would likely establish a shift in market structure. Forex signals can provide valuable insights as traders monitor these key levels and market dynamics.
Note: Learn2.trade is not a financial advisor. Do your research before investing your funds in any financial asset, product, or event. We are not responsible for your investment results.
Trade on MT4 with Leverage up to 1:500! Trade on MT4 with Leverage up to 1:500!
X
We use cookies to ensure that we give you the best experience on our website. If you continue to use this site we will assume that you are happy with it.