Don’t invest unless you’re prepared to lose all the money you invest. This is a high-risk investment and you are unlikely to be protected if something goes wrong. Take 2 minutes to learn more
Market Analysis – September 18
US Oil (WTI) bulls edge close to the 91.009 price level. The oil price has displayed a bold bullish move. It is clear that the bulls relentlessly pushed the price beyond the 84.960 hurdle level.
US Oil (WTI) Key Levels
Resistance Levels: 91.000, 84.960
Support Levels: 76.600, 66.830
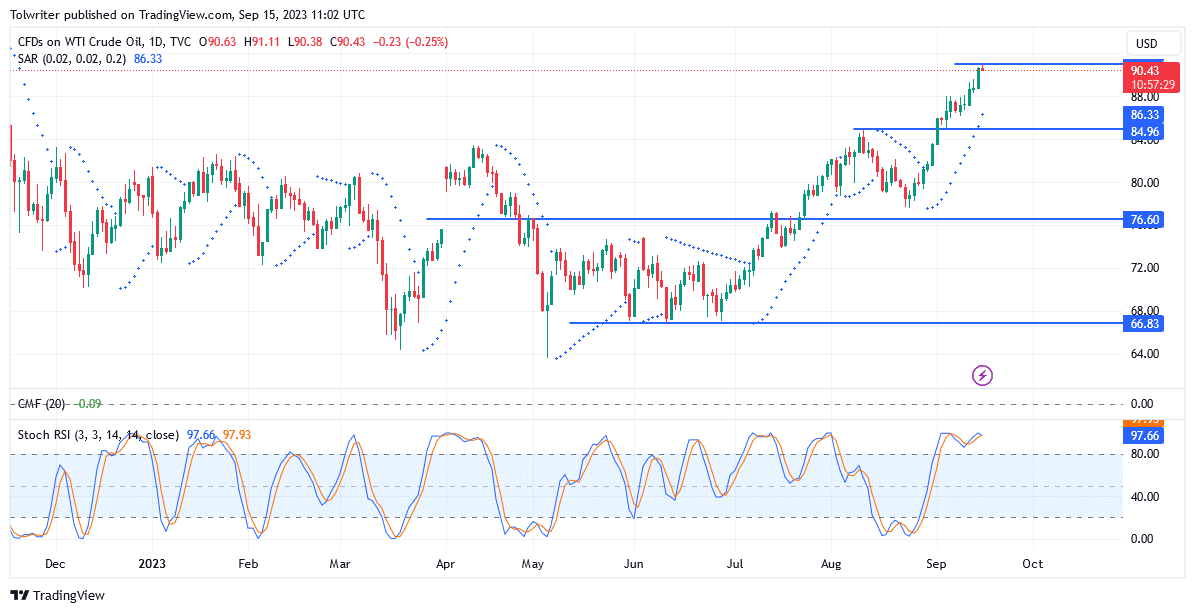
US Oil WTI Long-Term Trend: Bullish
The bullish momentum that currently propels WTI began in July. It is worth noting that a price retracement occurred at the 76.600 key level before a breakout ensued. This retracement, while short-lived, laid the foundation for the subsequent surge in bullish sentiment. Buyers demonstrated remarkable tenacity, propelling the price close to the 84.960 market level.
i
The historical patterns suggest that the path to the 91.000 key level may not be straightforward. As in the past, WTI’s price was pushed downward near the 76.600 market level. Given the significance of the 91.000 level, traders should anticipate a potential price pullback in the US oil market.
i
The Parabolic SAR (Stop and Reverse) indicator shows a consistent form of bullish action. It displays the trending dots increasing, but there are no visible signs of reversal yet. This suggests that bullish sentiment remains intact, but caution is warranted.
i
On the other hand, the Stochastic RSI (Relative Strength Index) provides a different perspective. It currently holds in the overbought region, indicating an extended bullish phase.
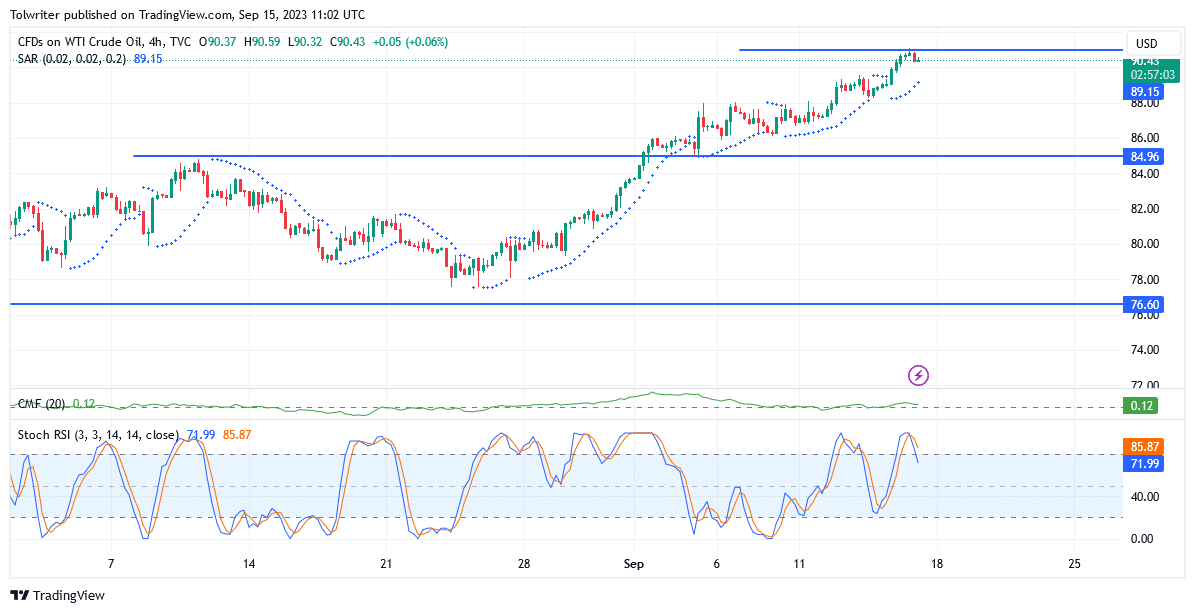
US Oil (WTI) Short-Term Trend: Bullish
On the 4-hour chart, the Stochastic RSI indicates a sell trend. This divergence suggests that traders should be prepared for a potential price pullback in the US oil market.
i
You can purchase Lucky Block – Guide, Tips & Insights | Learn 2 Trade here. Buy LBLOCK
Note: Learn2.trade is not a financial advisor. Do your research before investing your funds in any financial asset or presented product or event. We are not responsible for your investing results.
- Broker
- Min Deposit
- Score
- Visit Broker

- Award-winning Cryptocurrency trading platform
- $100 minimum deposit,
- FCA & Cysec regulated
9.8

- 20% welcome bonus of upto $10,000
- Minimum deposit $100
- Verify your account before the bonus is credited
9
- Fund Moneta Markets account with a minimum of $250
- Opt in using the form to claim your 50% deposit bonus
9
Learn to Trade
Never Miss A Trade Again

step 1
Signal Notification
Real-time signal notifications whenever a signal is opened, closes or Updated

step 2
Get Alerts
Immediate alerts to your email and mobile phone.

step 3
Entry Price Levels
Entry price level for every signal Just choose one of our Top Brokers in the list above to get all this free.