DeFI Coin Price Forecast: September 27
The DeFi Coin price forecast posits that the market is prepared to continue its rise up to $0.09000. After the consolidation that occurred at the 0.08300 zone, the market resumed with the surge that saw the DEFC price hit the current price.
DEFCUSD Long-Term Trend: Bullish (1-Hour Chart)
Significant Levels
Supply zone: $0.08570, $0.07350
Demand zone: $0.07570, $0.06950 .0900" width="1888" height="1042" data-lazy-src="https://learn2.trade/wp-content/uploads/2022/09/27dd.jpg"/>
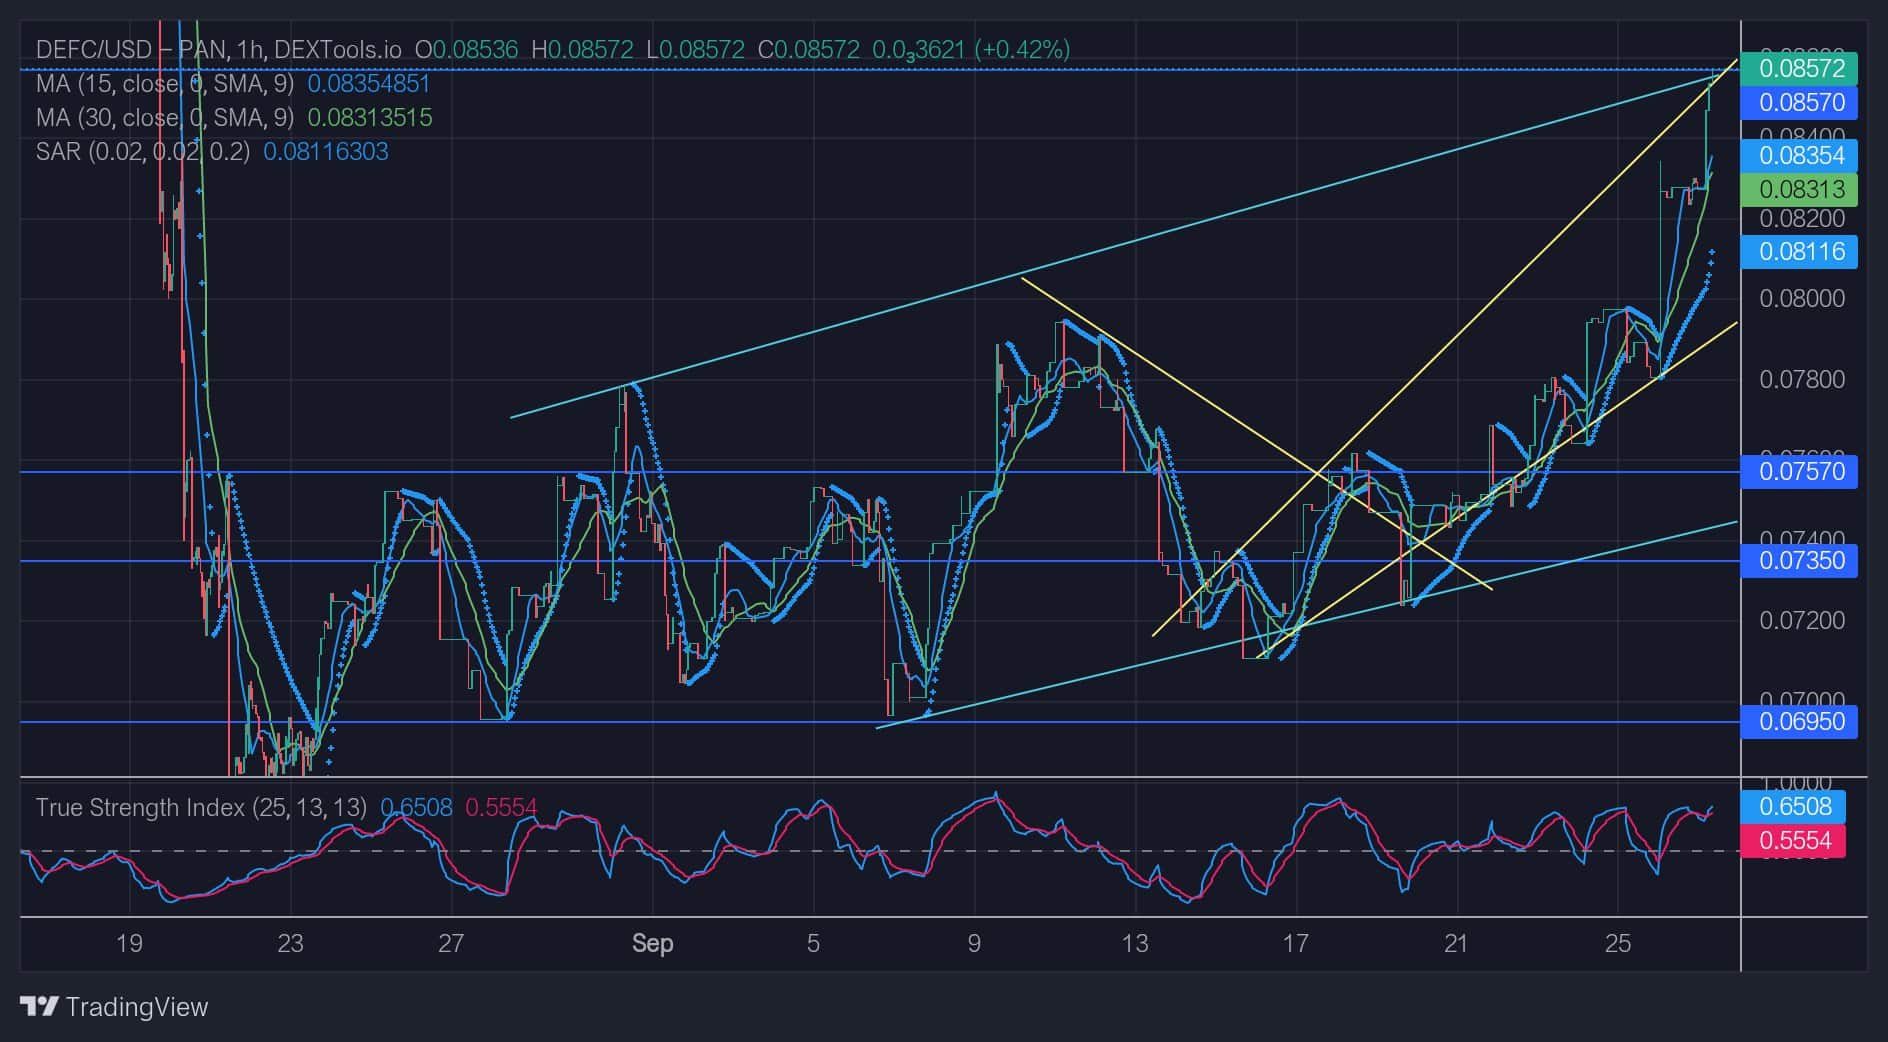
On the 20th of September, there was a breakout from the $0.07200 level. It was from this point that DEFCUSD began the bullish pressure that culminated in the $0.08000 ceiling breakthrough. The push from buy-traders who bought at the $0.07200 discount provided has driven the market to this high, which was last reached on August 19.
DeFI Coin Price Forecast: Market Outlook
The True Strength Index indicator has maintained its position after crossing over the centerline. This indicates that the trend direction change that occurred at $0.07800 has remained on course. The uptrend, save for the power struggle (consolidation) that happened at the $0.8300 level, has continued, ever since its sharp rise earlier in the week.
Multiple dots of the Parabolic SAR (Stop and Reverse) indicator can be seen laying below the bullish candlesticks, showing that the bullish run is holding up well. This is also an indication that this run can be expected to continue for much longer.
The Moving Average indicator on period 30 supports the impulsive position the DEFI market is holding. The indicator’s period 15 also agrees with the market’s impressive run of form.
DEFC Medium-Term: Trend Bullish (15-Minute Chart)
In this shorter time frame, the market holds the same stance. The Parabolic SAR still maintains support for the upward direction the market is moving..0900" width="1888" height="1042" data-lazy-src="https://learn2.trade/wp-content/uploads/2022/09/27d4.jpg"/>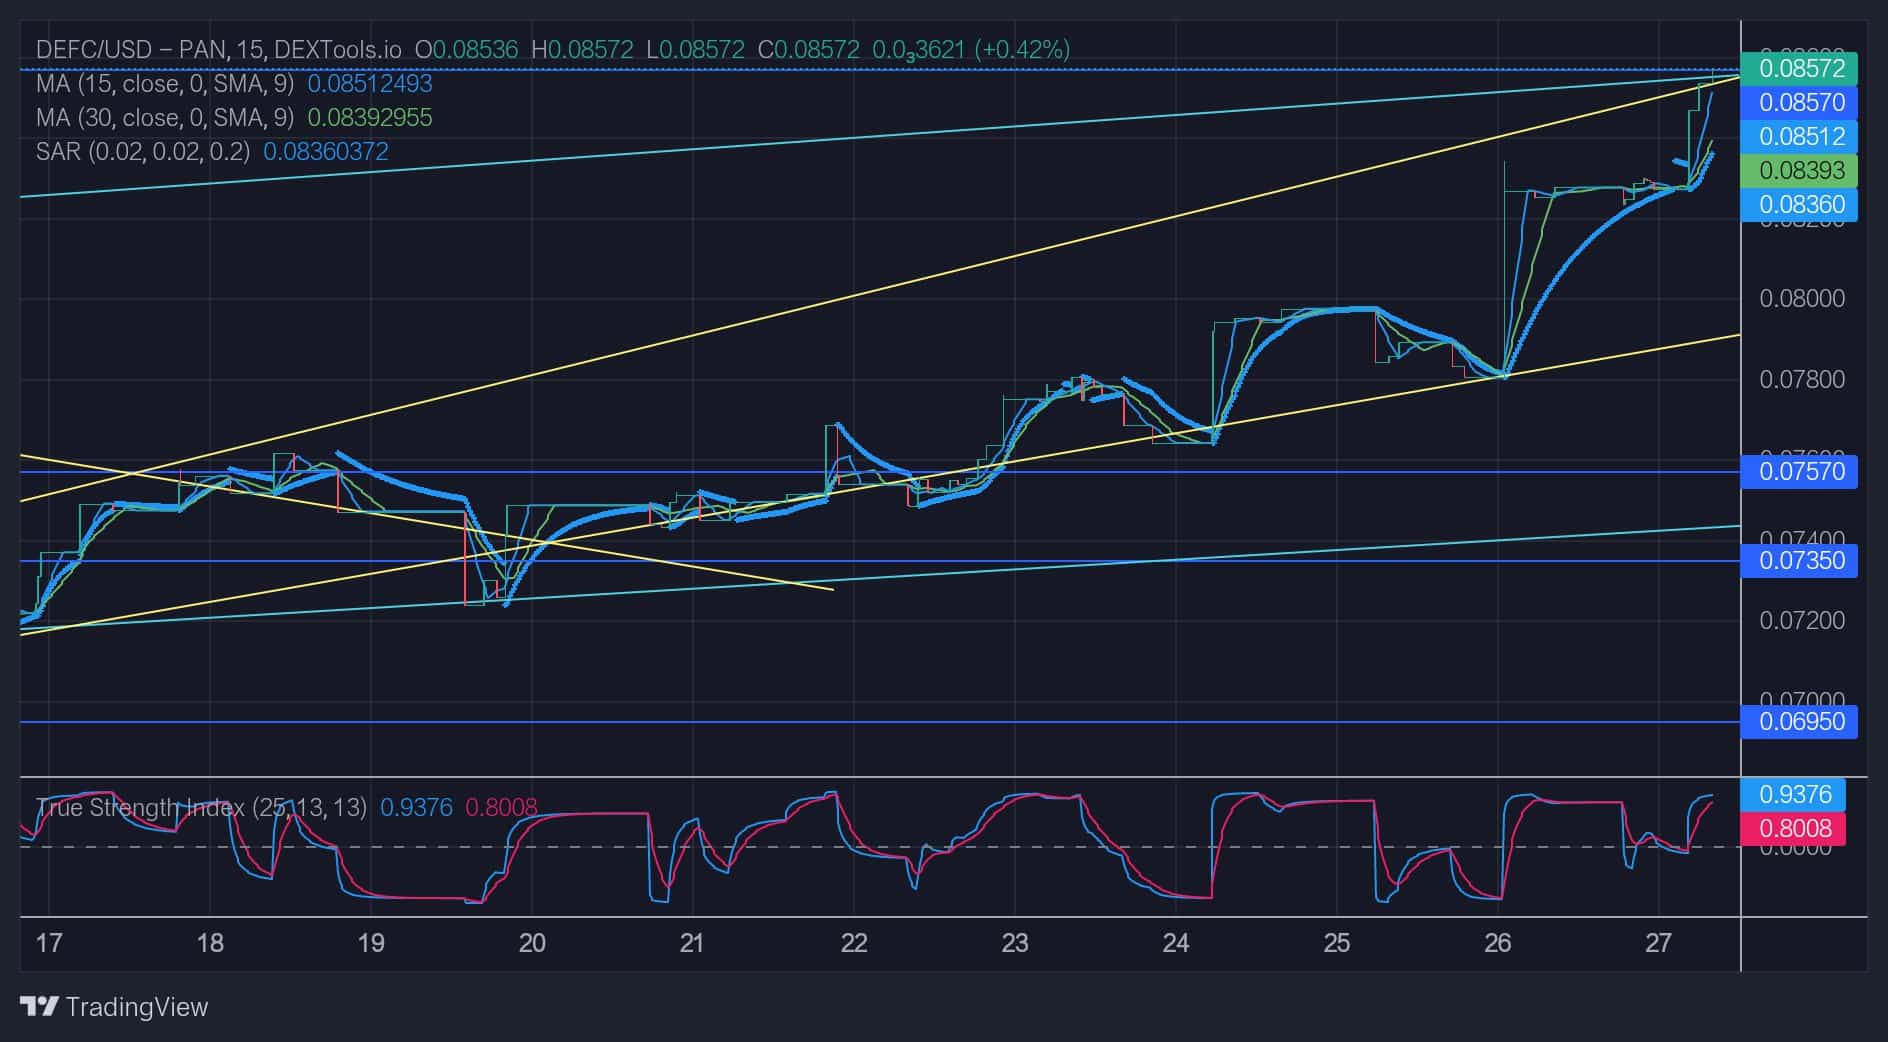
You can purchase Lucky Block here. Buy LBLOCK
Note: Learn2.trade is not a financial advisor. Do your research before investing your funds in any financial asset or presented product or event. We are not responsible for your investing results.
- Broker
- Min Deposit
- Score
- Visit Broker

- Award-winning Cryptocurrency trading platform
- $100 minimum deposit,
- FCA & Cysec regulated

- 20% welcome bonus of upto $10,000
- Minimum deposit $100
- Verify your account before the bonus is credited
- Fund Moneta Markets account with a minimum of $250
- Opt in using the form to claim your 50% deposit bonus
Learn to Trade
Never Miss A Trade Again

Signal Notification
Real-time signal notifications whenever a signal is opened, closes or Updated

Get Alerts
Immediate alerts to your email and mobile phone.

Entry Price Levels
Entry price level for every signal Just choose one of our Top Brokers in the list above to get all this free.