Further increase of the bulls’ momentum may break up the resistance level of $0.30, which may leads to further price increase to the $0.42, later it may extend to $0.50 level. In case the bulls’ pressure are unable to break up the resistance level of $0.30, bears may continue to dominate the Stellar market and the price may decrease towards the $0.22, $0.16 and $0.11 support levels.
Key Levels:
Resistance levels: $0.30, $0.42, $0.50
Support levels: $0.22, $0.16, $0.11
XLM/USD Long-term Trend: Bearish
On the daily chart, Stellar is bearish. The bearish momentum has pushed the coin to the support level of $0.22. The sellers’ pressure is becoming weak and the mentioned level could not be penetrated. Last week, the bulls are gradually increasing their momentum to push the coin towards north side. The price has penetrated the fast moving dynamic resistance upside to indicate an increase in the Bulls’ pressure.
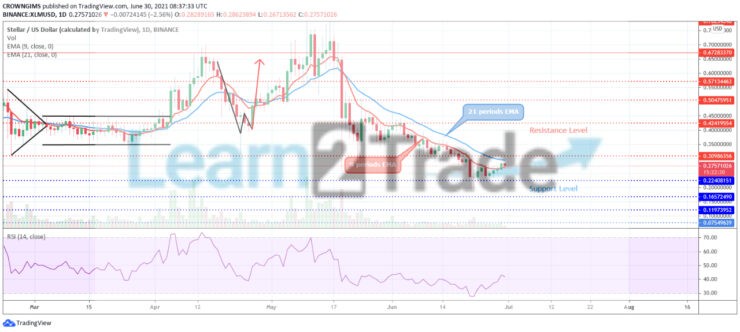
Stellar is trading between the 9 periods EMA and 21 periods EMA which indicate an increase of bullish momentum. Further increase of the bulls’ momentum may break up the resistance level of $0.30, which may leads to further price increase to the $0.42, later it may extend to $0.50 level. In case the bulls’ pressure are unable to break up the resistance level of $0.30, bears may continue to dominate the Stellar market and the price may decrease towards the $0.22, $0.16 and $0.11 support levels. However, the relative strength index period 14 is bending up at 40 levels to indicate buy signal.
XLM/USD Medium-term Trend: Bullish
XLM is on the bullish movement in the 4-hour chart. The bearish momentum was rejected at the support level of $0.22 on June 22. A bullish engulfing candle formed triggered the bullish action. The price is increasing towards the resistance level of $0.30. At the moment, it is carrying out a pullback.
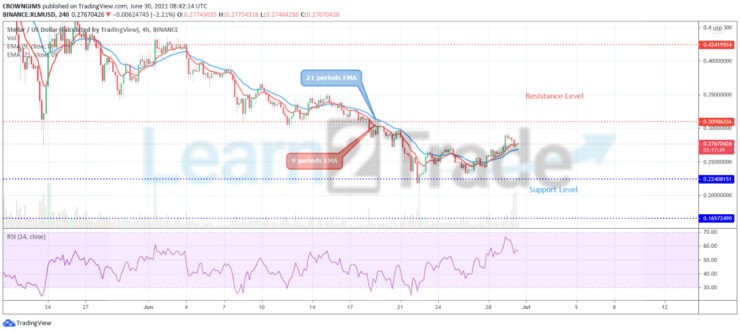
The price is trading above the 9 periods EMA and the 21 periods EMA as a sign of bullish movement. However, the Relative Strength Index period 14 is at 50 levels pointing down to indicate sell signal.
You can purchase crypto coins here. Buy Tokens
- Broker
- Min Deposit
- Score
- Visit Broker

- Award-winning Cryptocurrency trading platform
- $100 minimum deposit,
- FCA & Cysec regulated

- 20% welcome bonus of upto $10,000
- Minimum deposit $100
- Verify your account before the bonus is credited
- Fund Moneta Markets account with a minimum of $250
- Opt in using the form to claim your 50% deposit bonus
Learn to Trade
Never Miss A Trade Again

Signal Notification
Real-time signal notifications whenever a signal is opened, closes or Updated

Get Alerts
Immediate alerts to your email and mobile phone.

Entry Price Levels
Entry price level for every signal Just choose one of our Top Brokers in the list above to get all this free.