Bulls’ momentum is increasing in USDCHF market
USDCHF Price Analysis – 17 March
In case the buyers exert enough pressure, the $0.93 barrier level might be breached, and the positive trend might carry on to the $0.94 and $0.95 levels. USDCHF may pass the $0.92 support level and decline toward the $0.91 and $0.90 support levels if sellers gain more pressure and hold the $0.93 resistance level.
USDCHF Market
Key Levels:
Resistance levels: $0.93, $0.94, $0.95
Support levels: $0.92, $0.91, $0.90
USDCHF Long-term trend: Bearish
USDCHF is on a bearish movement on the Long-term outlook. Last two weeks, the purchasers were in control of the market. The price was pushed to the resistance level of $0.93 level. It experienced a ranging movement for a few days. On 09 March, a bearish engulfing candle formed, and the price declined to test the support level of $0.90. Last week, Buyers opposed the sellers at the just mentioned level and the price tested the $0.93 level, it is pulling back at the moment.
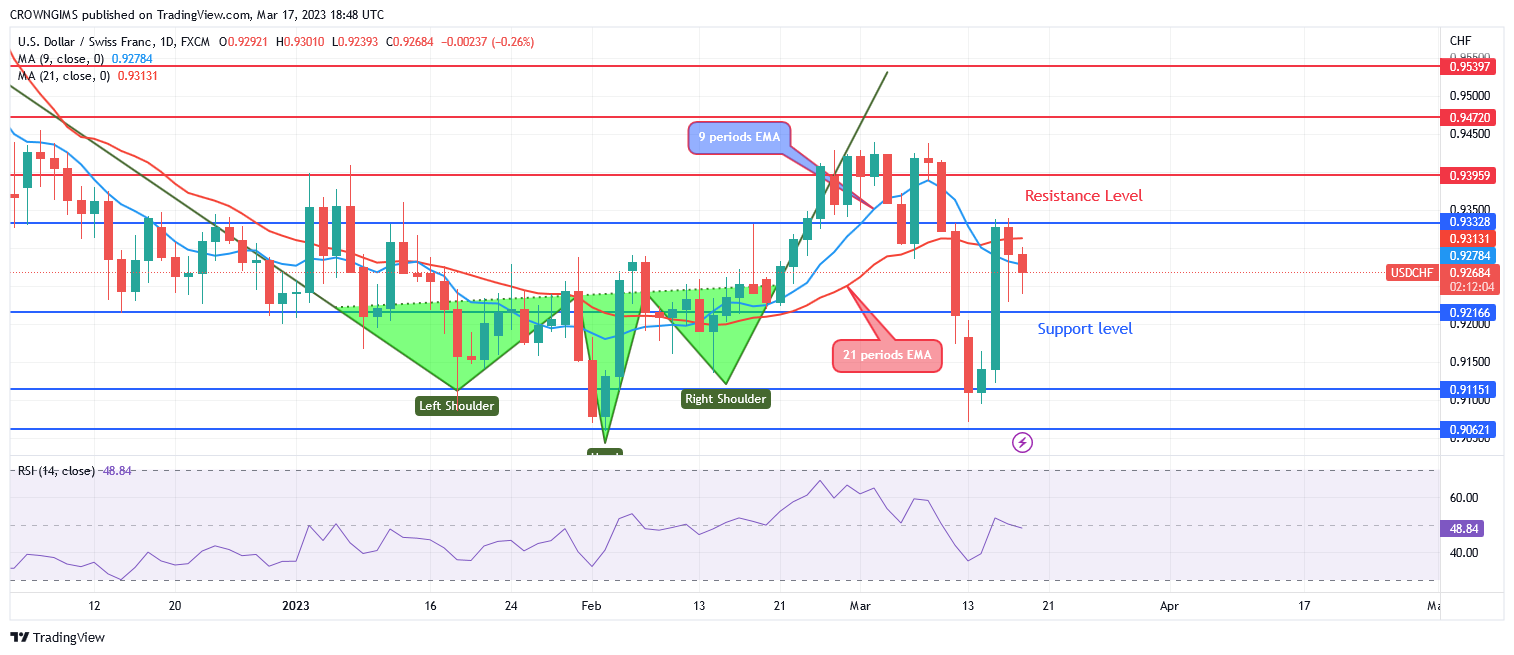
The USDCHF is trading slightly below the two EMAs and the 9-period EMA has crossed the 21-period EMAs. Relative Strength Index period 14 at 48 levels indicating a bearish market. In case the buyers exert enough pressure, the $0.93 barrier level might be breached, and the positive trend might carry on to the $0.94 and $0.95 levels. The price may pass the $0.92 support level and decline toward the $0.91 and $0.90 support levels if sellers gain more pressure and hold the $0.93 resistance level.
USDCHF Medium-term Trend: Bullish
USDCHF is bullish in the medium-term outlook. On the 4-hour chart, a double top pattern was seen when the price reached $0.93. The market for USD/CHF enters a bearish trend. When buyers were trying to increase the price around the $0.93 resistance level, sellers stepped in and forced the price to drop until it reached the $0.90 support level. The price bounced up and tested $0.93 and it is pulling back.
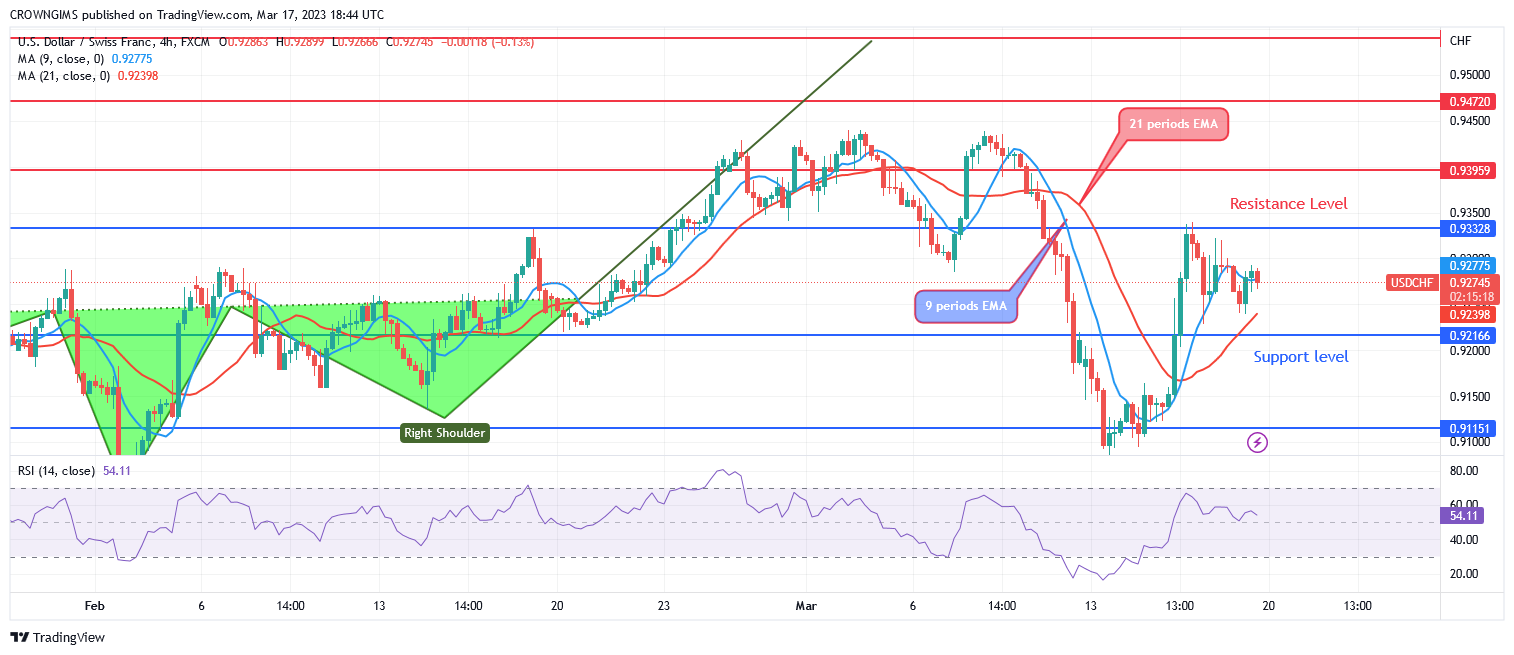
The 9-period EMA is above the 21-period EMA. The USDCHF is currently trading above the two EMAs, indicating bullish momentum. The signal line on the Relative Strength Index period 14 is displaying a bearish direction at the 50 levels which may be a pullback.
You can purchase Lucky Block here. Buy LBLOCK
- Broker
- Min Deposit
- Score
- Visit Broker

- Award-winning Cryptocurrency trading platform
- $100 minimum deposit,
- FCA & Cysec regulated

- 20% welcome bonus of upto $10,000
- Minimum deposit $100
- Verify your account before the bonus is credited
- Fund Moneta Markets account with a minimum of $250
- Opt in using the form to claim your 50% deposit bonus
Learn to Trade
Never Miss A Trade Again

Signal Notification
Real-time signal notifications whenever a signal is opened, closes or Updated

Get Alerts
Immediate alerts to your email and mobile phone.

Entry Price Levels
Entry price level for every signal Just choose one of our Top Brokers in the list above to get all this free.