Key Resistance Levels: $60, $62, $64
Key Support Levels: $40,$38,$36
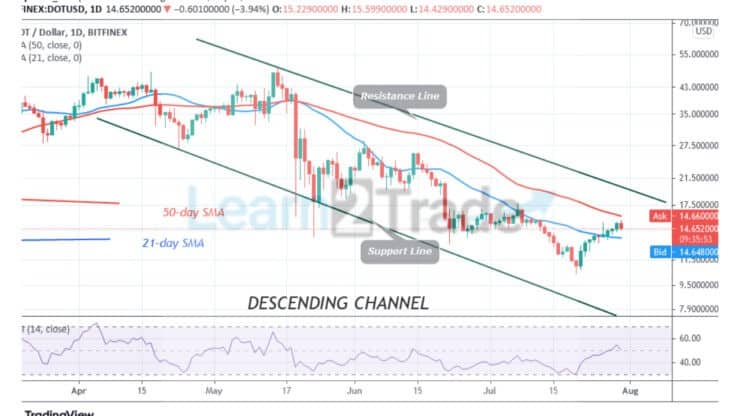
Polkadot (DOT) Price Long-term Trend: Bearish
Today, Polkadot’s (DOT) is retracing after facing rejection at the $15.60 resistance. The crypto fell to $14.40 low and resumed an upward move. Since July 26, Polkadot has been facing rejection at the $15.24 resistance. On the upside, if buyers breach the $15.24 high, the market will rise to $17 high. On the other hand, if the DOT/USD faces rejection, the DOT price will continue to fluctuate between $13 and $15.24.
Daily Chart Indicators Reading:
Polkadot is at level 50 of the Relative Strength Index period 14. It indicates that there is a balance between supply and demand. The 21-day and the 50-day SMAs are sloping southward indicating the downtrend. The price bars are below the moving averages which suggest further downsides.
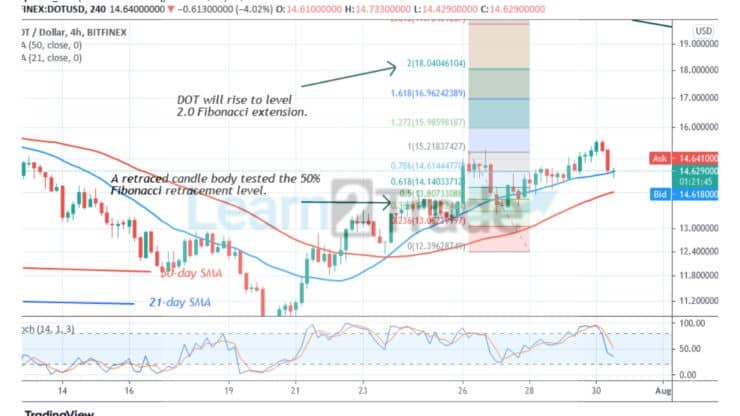
Polkadot (DOT) Medium-term Trend: Bearish
On the 4 hour chart, the altcoin is making an uptrend. The uptrend is facing rejection as price fell above the 21-day Support. The uptrend is likely to continue if the 21-day SMA support holds.Meanwhile, on July 21 uptrend; a retraced candle body tested the 50% Fibonacci retracement level. The retracement indicates that the DOT price will rise to level 2.0 Fibonacci extensions or level $18.04.
4-hour Chart Indicators Reading
The crypto is below the 50% range of the daily stochastic. It indicates that the altcoin is in a bearish momentum. The 21-day SMA and the 50-day SMA are sloping upward indicating the uptrend. The altcoin has a bullish crossover as the 21-day SMA crosses over the 50-day SMA. This indicates a buy signal.
General Outlook for Polkadot (DOT)
DOT/USD is still trading in the bearish trend zone. Presently, crypto has resumed an upward move. The upward move is facing rejection at the 50-day SMA. If price breaks above the 50-day SMA, the crypto will be in the bullish trend zone.
You can purchase crypto coins here. Buy Tokens
Note: Learn2Trade is not a financial advisor. Do your research before investing your funds in any financial asset or presented product or event. We are not responsible for your investing results
- Broker
- Min Deposit
- Score
- Visit Broker

- Award-winning Cryptocurrency trading platform
- $100 minimum deposit,
- FCA & Cysec regulated

- 20% welcome bonus of upto $10,000
- Minimum deposit $100
- Verify your account before the bonus is credited
- Fund Moneta Markets account with a minimum of $250
- Opt in using the form to claim your 50% deposit bonus
Learn to Trade
Never Miss A Trade Again

Signal Notification
Real-time signal notifications whenever a signal is opened, closes or Updated

Get Alerts
Immediate alerts to your email and mobile phone.

Entry Price Levels
Entry price level for every signal Just choose one of our Top Brokers in the list above to get all this free.