DeFI Coin Price Anticipation – July 17
The DeFI Coin price anticipation affords the market a bullish restart after the coin suddenly spikes downward to its all-time low level.
DEFCUSD Long-Term Trend: Bullish (1-hour Chart)
Key Levels:
Supply Zones: $0.13890, $0.12200
Demand Zones: $0.10620, $0.08060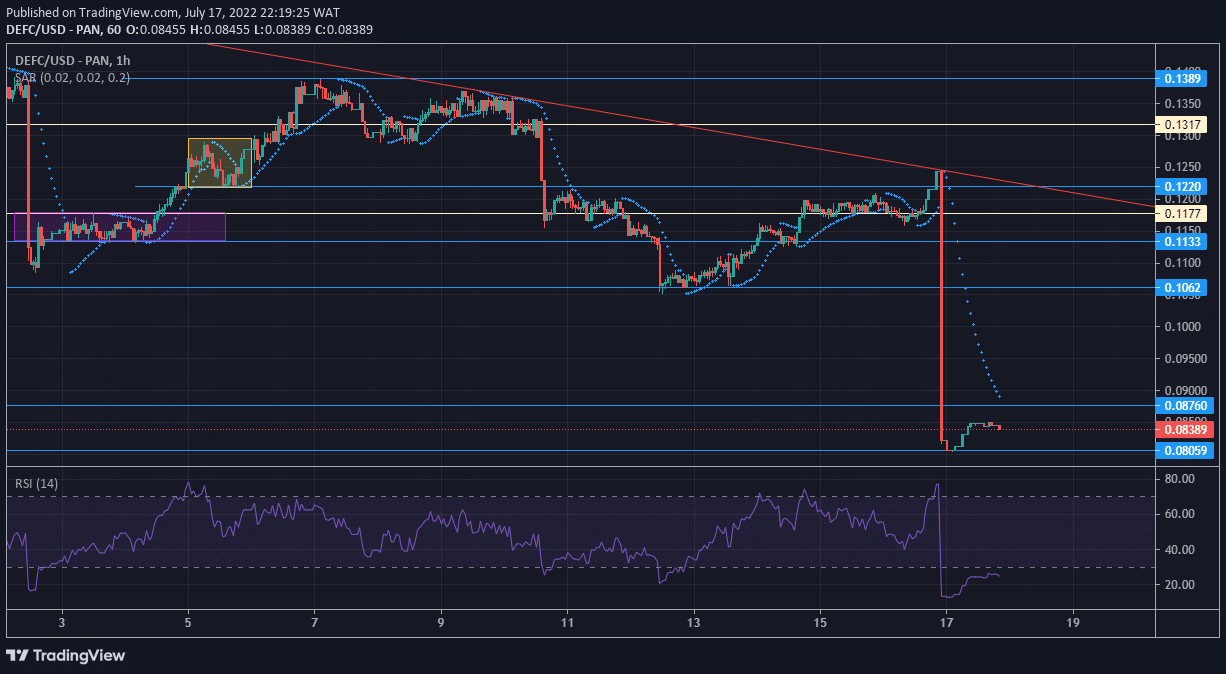
DeFI Coin Price Forecast: DEFCUSD Market Prospects
The market commenced an upward trend from the $0.10620 support zone on the 13th of July. A series of retracements preceded the violation of the key level as the price glid upwards.
However, as the market approached the descending trendline, the price began to move sideways. This shows the hesitation of the coin to confront the trendline. When the price eventually rose to meet the trendline, it suffered acute rejection.
DeFI coin has plummeted to a level not previously reached at $0.080590. Buyers are regaining strength at this level and are taking new steps to reintroduce bullishness into the coin.
DEFCUSD Medium-Term Trend: Bullish (15-Minute Chart)
The 15-minute chart shows that the indecisiveness of the price above the $0.11770 critical level may have allowed the bears an opportunity to inflict the market. After the long sideways movement, the market plunged when it tested the trendline. As a result, the RSI line has taken a strong dip directly from overbought to oversold.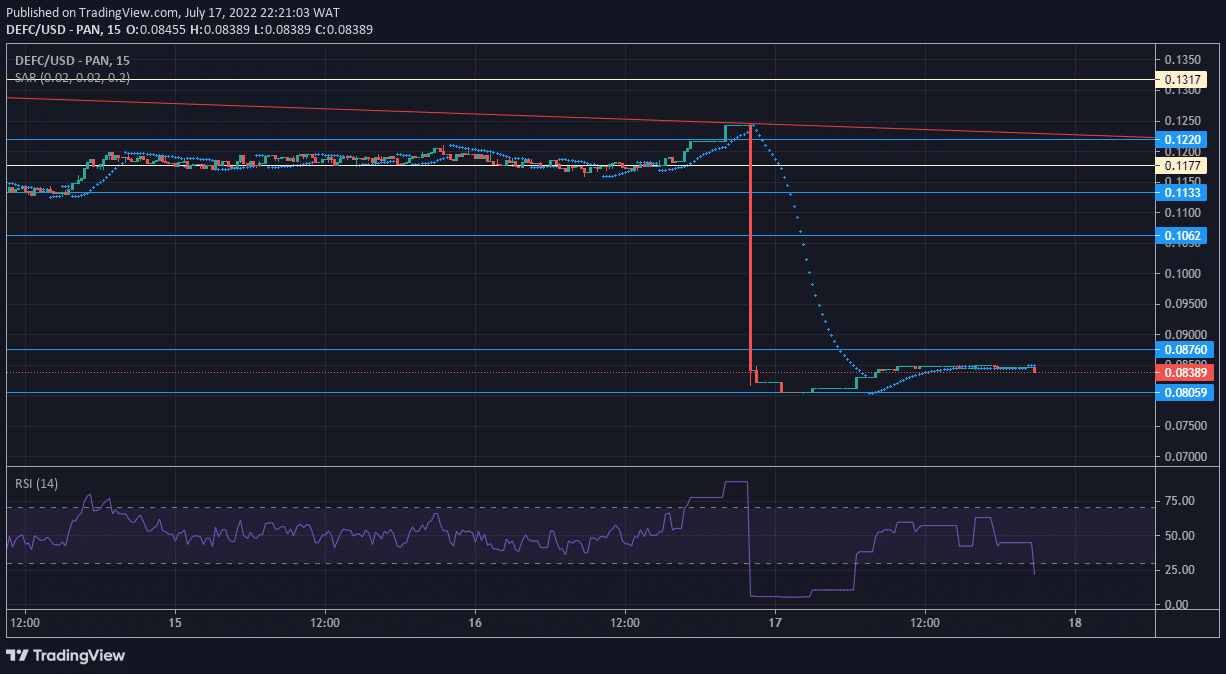
You can purchase DeFi Coin here: Buy DEFC
Note: Learn2.trade is not a financial advisor. Do your research before investing your funds in any financial asset or presented product or event. We are not responsible for your investing results.
- Broker
- Min Deposit
- Score
- Visit Broker

- Award-winning Cryptocurrency trading platform
- $100 minimum deposit,
- FCA & Cysec regulated

- 20% welcome bonus of upto $10,000
- Minimum deposit $100
- Verify your account before the bonus is credited
- Fund Moneta Markets account with a minimum of $250
- Opt in using the form to claim your 50% deposit bonus
Learn to Trade
Never Miss A Trade Again

Signal Notification
Real-time signal notifications whenever a signal is opened, closes or Updated

Get Alerts
Immediate alerts to your email and mobile phone.

Entry Price Levels
Entry price level for every signal Just choose one of our Top Brokers in the list above to get all this free.