BNBUSD Price Analysis – May 14
Inability to break down the support level of $503 by the bears, BNBUSD will break up the $678 and bullish trend may continue to the resistance levels at $758, and $850.
BNBUSD Market
Key levels:
Resistance levels: $678, $758, $850
Support levels: $599, $503, $420
BNBUSD Long-term trend: Bearish
Binance coin is bearish on the daily chart. The crypto was trading between the resistance level of $678 and the support level of $599 last week. The coin has tested the resistance level of $678 twice which indicate a signal for the bears to dominate the Binance coin market. On 12 May, the bears prevailed over the bulls with the formation of strong bearish candle that breaks down the support level of $599, the price is decreasing towards the $503 price level.
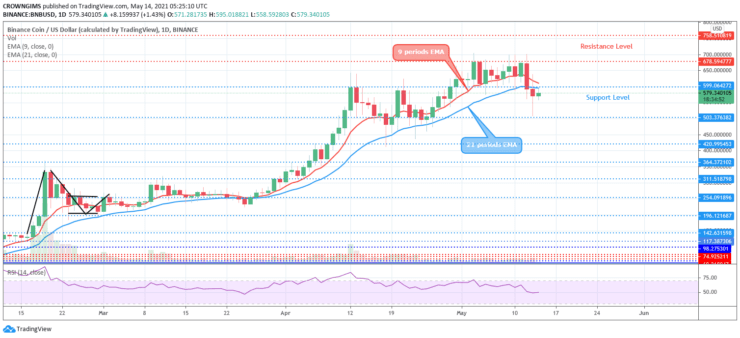
Binance Coin has penetrated the fast moving average and the slow moving average downside. The coin is trading below the 9 periods EMA and 21 periods EMA at close contact which indicate that the bears’ momentum is gradually increasing in the Binance coin market. The Relative Strength Index period 14 is at 50 levels with the signal lines pointing up to indicate buy signal which may be a pullback. Further increase in the sellers’ momentum will push down the Binance Coin to break the support level of $503 and if the daily candlestick close below it, then, the price may decrease further to test the $420 support levels. Inability to break down the support level of $503 by the bears, BNBUSD will break up the $678 and bullish trend may continue to the resistance levels at $758, and $850.
BNBUSD medium-term Trend: Bearish
BNBUSD is bearish in the 4-hour chart. The price action formed a “Tripple top” on the 4-hour chart; this is a bearish chart pattern. The price tested the resistance level of $678 on May 03. The second touch was on May 10 and the third time was on May 12. The price could not penetrate the level but rather breaks down the $593 level.
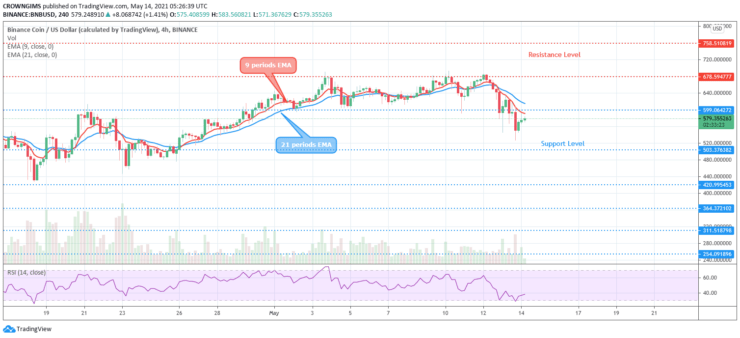
Binance coin is trading below 9 periods EMA and 21 periods EMA which indicate an increase in the bears’ momentum.
You can purchase crypto coins here: Buy coins
- Broker
- Min Deposit
- Score
- Visit Broker

- Award-winning Cryptocurrency trading platform
- $100 minimum deposit,
- FCA & Cysec regulated

- 20% welcome bonus of upto $10,000
- Minimum deposit $100
- Verify your account before the bonus is credited
- Fund Moneta Markets account with a minimum of $250
- Opt in using the form to claim your 50% deposit bonus
Learn to Trade
Never Miss A Trade Again

Signal Notification
Real-time signal notifications whenever a signal is opened, closes or Updated

Get Alerts
Immediate alerts to your email and mobile phone.

Entry Price Levels
Entry price level for every signal Just choose one of our Top Brokers in the list above to get all this free.